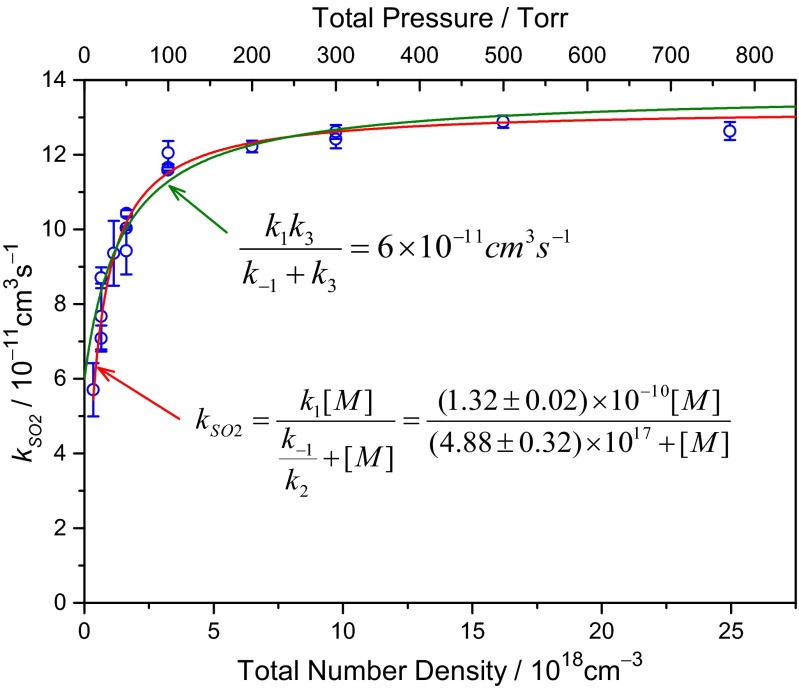
Fig. 5.
Observed second-order rate coefficient of (CH3)2COO reaction with SO2 plotted as a function of the total pressure and number density. The fitting is plotted as solid lines. The error bars of the data indicate the SDs. The errors in the fitted equation are the SDs resulting from the fitting only, not including any possible systematic uncertainty yet. There are 18 independent measurements.

