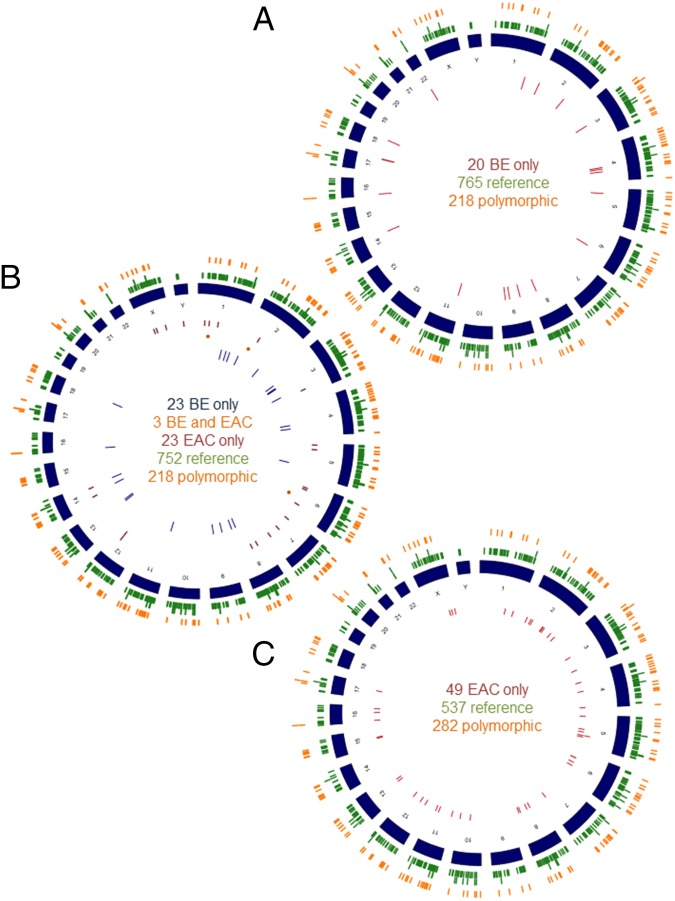
Fig. 1.
(A) Circos diagram mapping the distribution throughout the human genome of 20 validated high-stringency (HS) insertions in BE only (inner red circle), the 765 low-stringency (LS) reference (outer green circle), and 218 LS polymorphic insertions (orange circle) detected with L1-seq. Group contains five individuals. (B) Circos diagram mapping the distribution of the validated 23 HS insertions in BE only (yellow circle), 3 BE and T (orange points), and 23 T only (red circle), as well as the LS reference (752) and LS polymorphic (218) insertions detected with L1-seq (green and orange, respectively). Group contains five individuals. (C) Circos diagram mapping the distribution of 49 validated high stringency insertions in tumor only (red circle), 537 LS reference (green circle), and 282 LS polymorphic (orange circle) insertions. The final group contains 10 individuals. The somatic insertions (e.g., all insertions that are not reference and polymorphic insertions) are all validated; however, the reference and polymorphic insertions have been previously published and are more common in the population and are therefore restricted only by a sequencing read count of 25 or greater and a map score of 0.5 or larger. For the Esophageal cancer group, our map scores were lower overall for the reference insertions; therefore, we restricted these insertions by a read count of 20 and a map score above 0.3.

