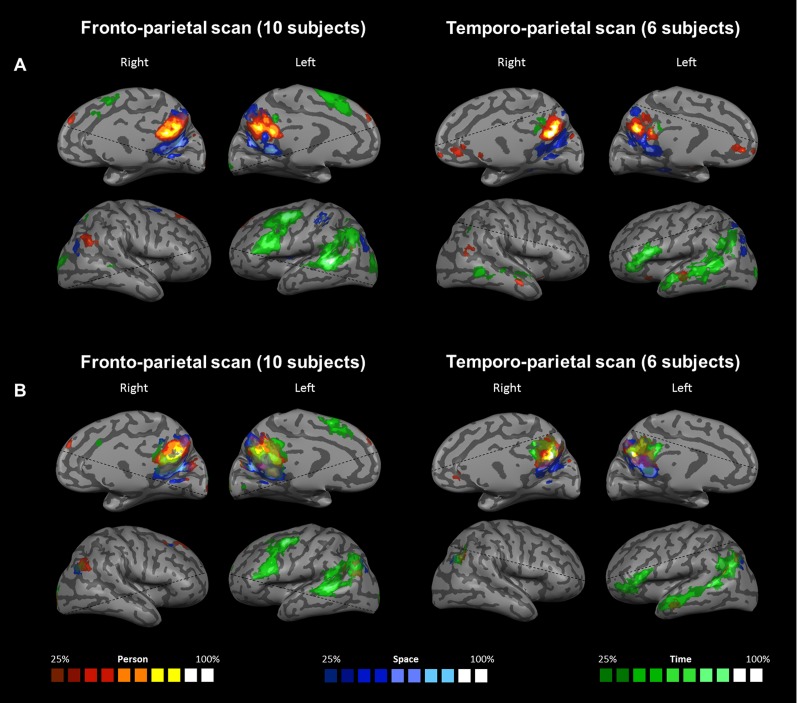
Fig. S4.
Probabilistic-maps group analysis. Two groups of subjects were analyzed separately based on the coverage of their functional scans: 10 subjects scanned with frontal and parietal coverage (Left), and 6 subjects scanned with temporal and parietal coverage (Right). (A) Contrast between each orientation domain (space, time, or person) and the other two domains, indicating regions of domain-specific activity. (B) Contrast between each orientation domain and the lexical control task. Original maps used for group analysis are presented in Figs. S1 and S2 and are FDR-corrected and cluster size-thresholded at 20 voxels per cluster. The probabilistic maps presented here are thresholded at 25% of subjects of each group.

