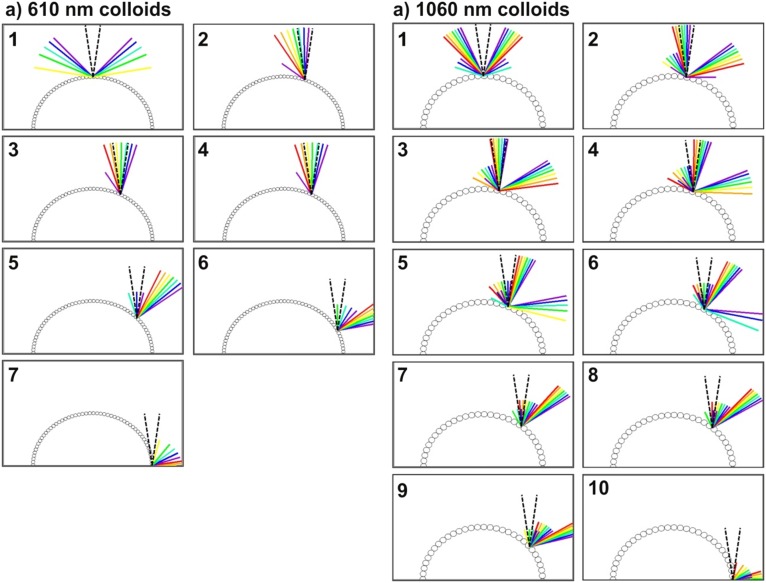
Fig. S8.
(A and B) Simulated grating diffraction from periodic arrangements of colloids at the balls’ surfaces for 610-nm colloids (A) and 1,060-nm colloids (B). The plots in Fig. 5 of the main text show the colors collected by the objective lens (i.e., the colors in the dashed-stripe cone) as they appear with increasing distance from the ball center.

