Fig. S3.
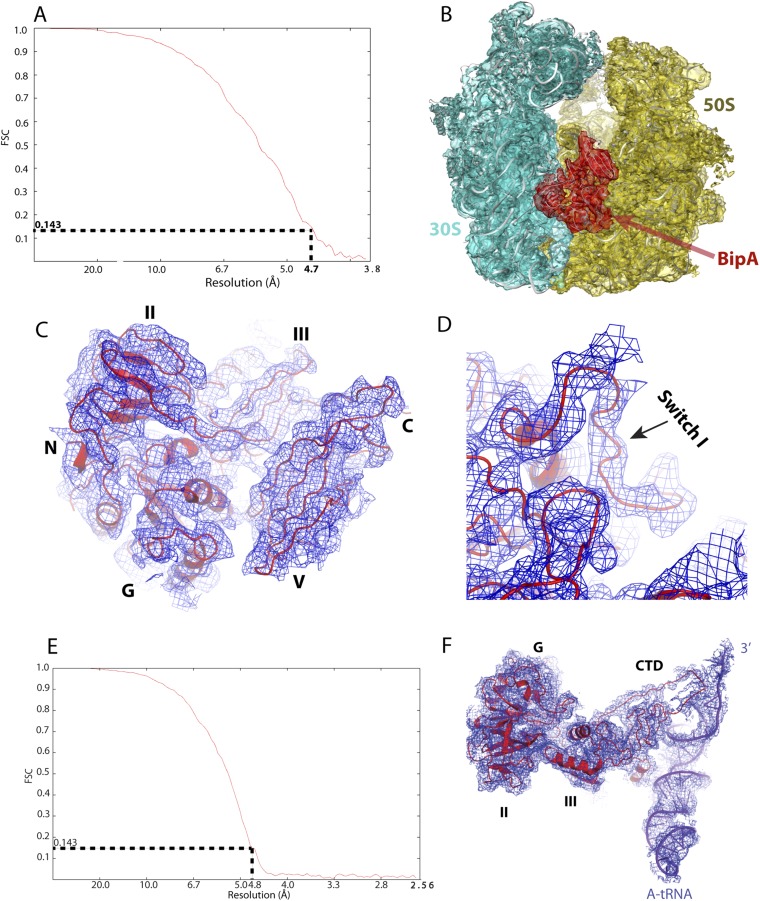
Quality of single-particle reconstitution of BipA–ribosome complex cryo-EM data. (A and E) Estimation of cryo-EM map resolution by Fourier shell correlation. Fourier shell correlation (FSC) curve for 3D reconstruction of the BipA–ribosome complex (A) and BipA-tRNA–ribosome complex (E). (B) Ribosome-bound BipA (red mesh) with corresponding cryo-EM reconstitution density for the 30S (cyan mesh) and 50S (dark orange) subunits. (C) Cryo-EM map (blue mesh) for BipA, in which helices and beta-strands are clearly visible. The red cartoon is modeled BipA. (D) Close-up view of cryo-EM map (blue mesh) for the switch I region. The switch I region of BipA is ordered upon binding to ribosome. (F) Cryo-EM map (blue mesh) for the BipA and A-tRNA showing the interactions. CTD of BipA becomes structured upon interaction with the A-tRNA.

