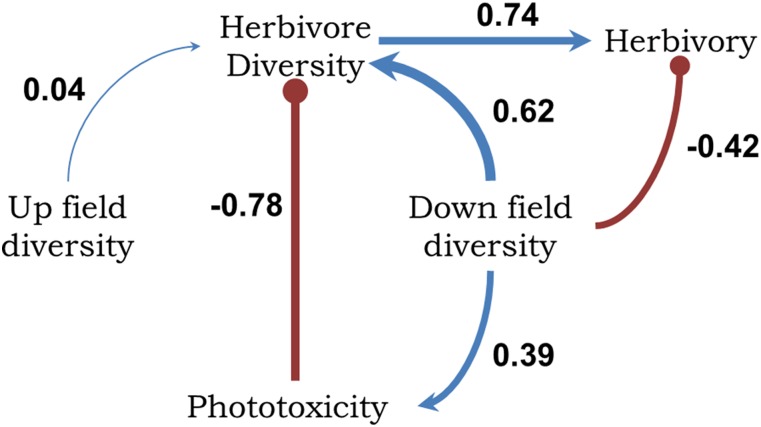
Fig. S3.
Path model based on predicted relationships between phytochemical diversity (including both upfield diversity and downfield diversity) and associated arthropod parameters for Piper species (model fit: χ2 = 2.415, df = 3, P = 0.49). Relationship strengths are indicated by the standardized path coefficient; blue lines indicate positive effects, and red lines indicate negative effects.

