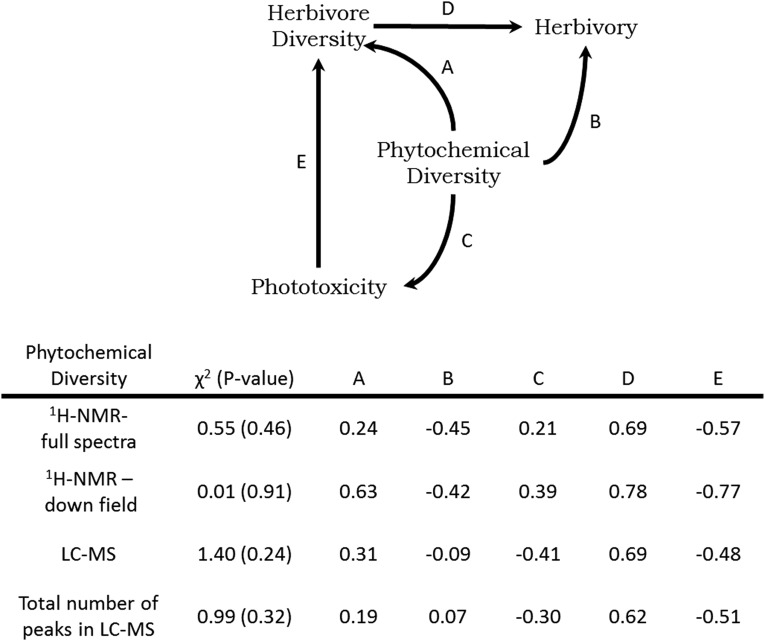
Fig. S4.
Summary of path models using different measures of phytochemical diversity: diversity quantified from 1H-NMR using the full spectra (0.5–14.0 ppm), diversity quantified from the downfield region (5.0–14.0 ppm), LC-MS spectra, and a sum of the total number of peaks from LC-MS. The table indicates model fit (χ2) and the standardized path coefficients for associated causal relationships.

