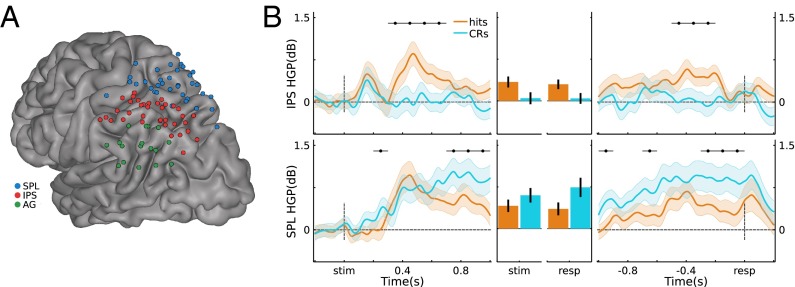
Fig. 1.
(A) Electrode coverage in left lateral PPC across participants. (B) Stimulus-locked (Left) and response-locked (Right) HGP time courses for Hits and CRs, for the IPS and SPL electrodes. Gray bars indicate significant differences between Hits and CRs (P < 0.05*; Bonferroni corrected; error bars, SEM). (Middle) Time-averaged HGP in IPS and SPL.

