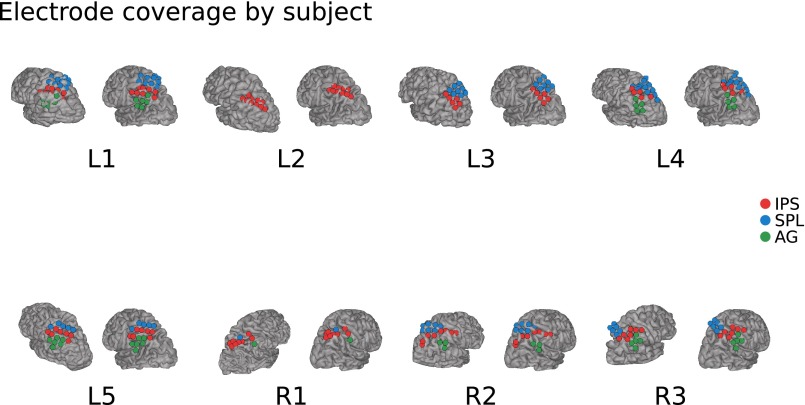
Fig. S2.
Electrode coverage on each participant. Two renderings per participant, one in native space (left) and the second projected into the Montreal Neurological Institute (MNI) standard template space (right). Color-coded are the anatomical labels based on the native space rendering and postoperative CT scans.

