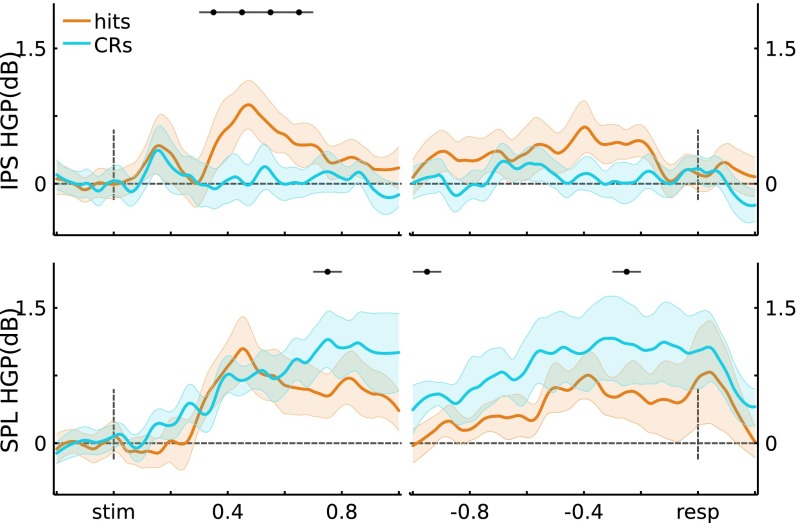
Fig. S3.
Subject-level HGP traces. Data were averaged at the individual participant ROI level, and then at the participant level. (Top) IPS (n = 5). Stimulus-locked: Hit trials showed greater power than CR trials from 300 ms to 600 ms poststimulus presentation (t(4) > 2.92, P < 0.05*); response-locked: no significant individual time windows. (Bottom) SPL (n = 4). Stimulus-locked: CR trials showed greater power than Hit trials from 700 ms to 800 ms poststimulus presentation (t(3) = 6.38, P < 0.05*); response-locked: CRs > Hits in the 1,000- to 900-ms and 300- to 200-ms preresponse windows (t(3) > 3.49, P < 0.05*). Error bars indicate across-participant SEM, and black horizontal lines indicate significance at P < 0.05* (Bonferroni corrected).

