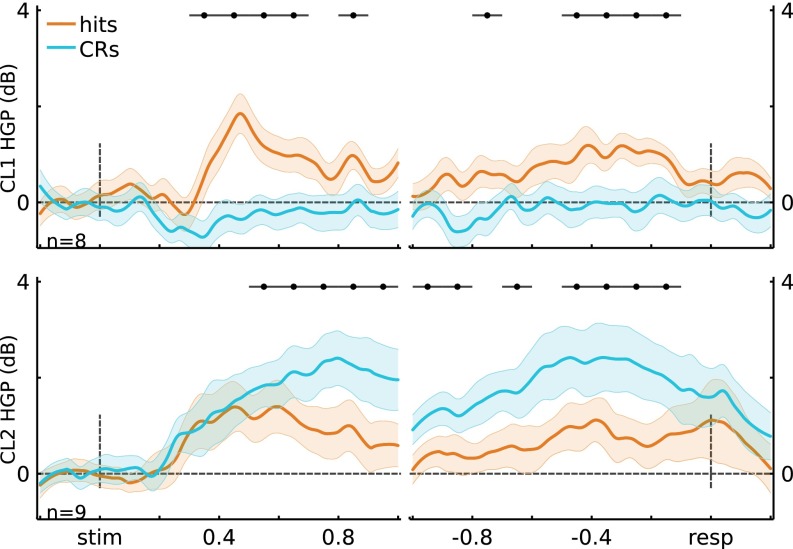
Fig. S8.
Cluster time courses for stimulus-locked electrode clusters (cluster 1, n = 8; cluster 2, n = 9). (Top) Cluster 1 time courses for stimulus-locked and response-locked data. Similar to the anatomical IPS grouping, cluster 1 showed Hits > CRs for stimulus-locked (ts(7) > 4.66, P < 0.05*; see figure for time windows of significance) and response-locked data (ts(7) > 4.35, P < 0.05*). (Bottom) Similar to the anatomical SPL grouping, cluster 2 showed CRs > Hits for stimulus-locked (t(8) > 4.47, P < 0.05*) and response-locked data (t(8) > 4.10, P < 0.05*). Error bars indicate across-channel SEM, and black horizontal lines indicate significance at P < 0.05*.

