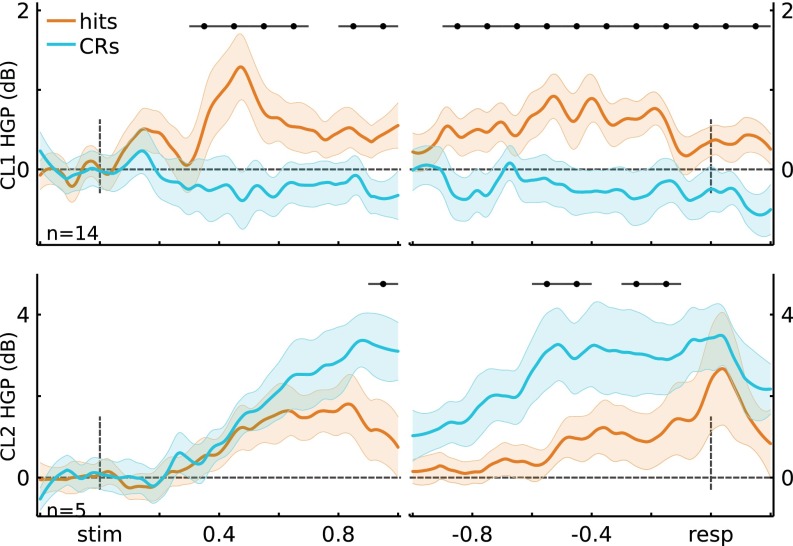
Fig. S9.
Cluster time courses for response-locked electrode clusters (cluster 1, n = 14; cluster 2, n = 5). (Top) Cluster 1 time courses for stimulus-locked and response-locked data. Cluster 1 showed Hits > CRs for stimulus-locked (t(14) > 3.93, P < 0.05*) and response-locked data (t(14) > 3.70, P < 0.05*). Cluster 2 showed CRs > Hits for stimulus-locked (t(4) = 8.24, P < 0.05*) and response-locked data (t(4) > 6.54, P < 0.05*). Error bars indicate across-channel SEM, and black horizontal lines indicate significance at P < 0.05*.

