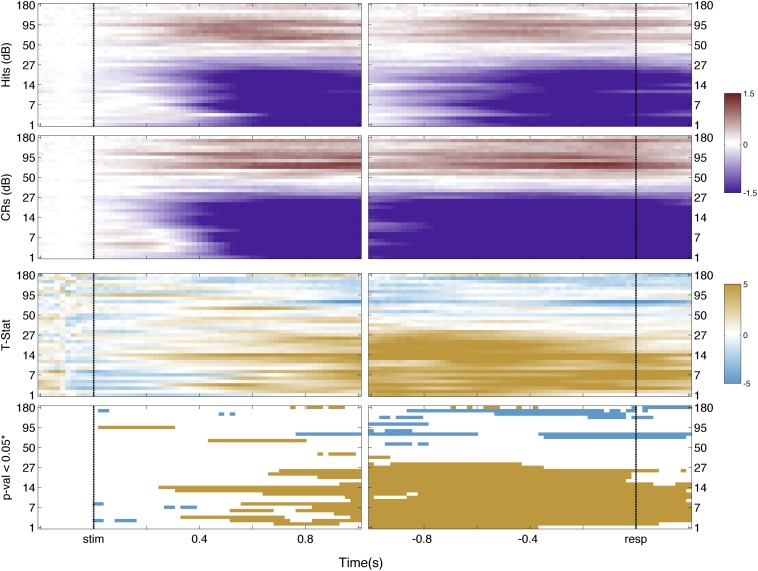
Fig. S14.
SPL spectrogram. First row indicates the time−frequency decomposition for Hit trials across SPL channels; second row is for CRs trials. Scale is in decibels. Third row indicates the t statistic on each spectrogram point. Scale is the t statistic. Fourth row indicates points that survived false discovery rate correction at an alpha level of 0.05. Colors indicate the direction of the effect: orange, Hit > CRs; cyan, CRs > Hits.

