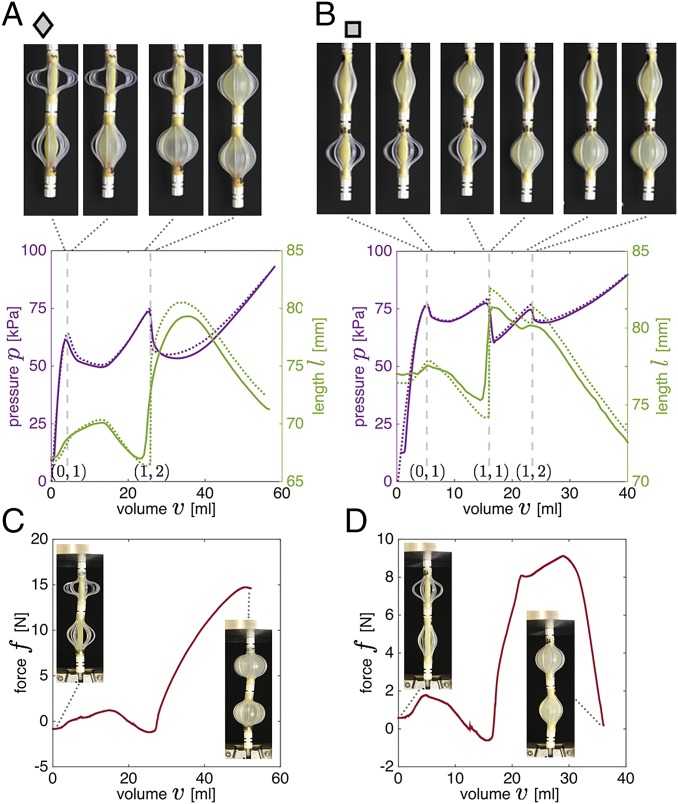
Fig. 5.
(A and B) Experimental (solid lines) and numerical (dashed lines) pressure–volume curves for two soft actuators comprising fluidic segments. (A) Results for a combined actuator with and mm. The transitions for this actuator are highlighted by diamond markers in Fig. 4. Snapshots of the combined actuators 0.5 mL before and after each state transition (at mL) are also shown. (B) Results for a combined actuator with and mm. The transitions for this actuator are highlighted by square markers in Fig. 4. Snapshots of the combined actuators 0.5 mL before and after each state transition (at mL) are also shown. Experimentally measured exerted force as a function of the supplied volume for a combined actuator with (C) and mm and (D) and mm with constrained ends.

