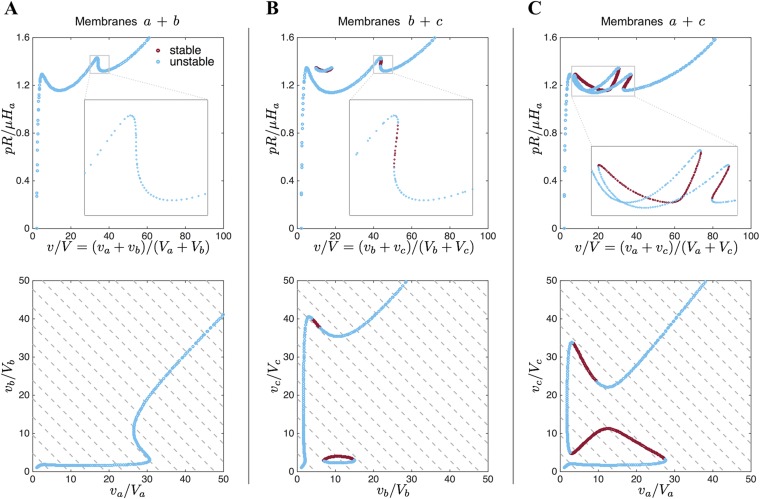
Fig. S2.
Response of two interconnected spherical membranes upon inflation. The response of the individual membranes is shown in Fig. S1. The equilibrium states and their stability have been obtained numerically. The pressure–volume relation and the relation between the volume of the individual membranes are shown for systems comprising (A) membranes a and b, (B) membranes b and c, and (C) membranes a and c.

