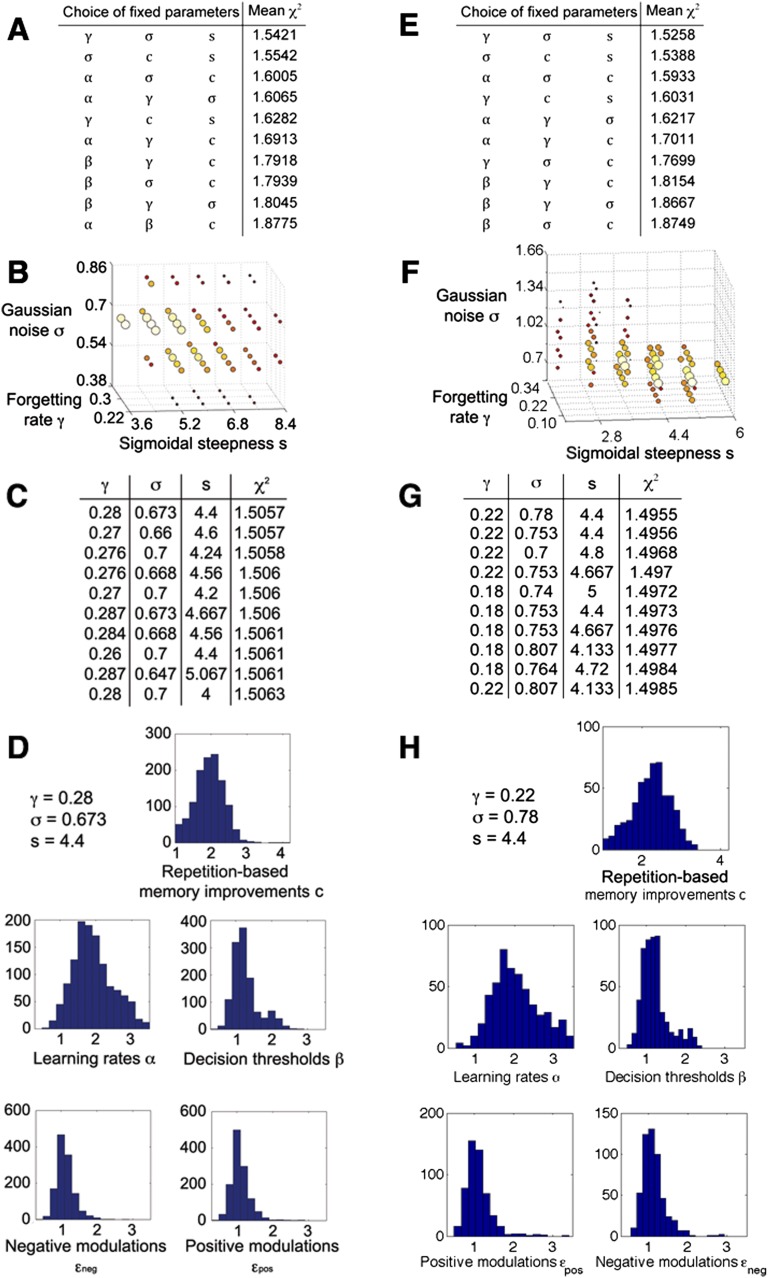
Fig. S2.
Parameter estimation results for the discovery sample (A–D) (modified from ref. 21) and the replication sample (E–H). (A and E) Stage 1: Based on a moderately accurate estimation of model parameters, two selections of fixed parameters (γ, σ, s and σ, c, s) are chosen for hill climbing. The best 10 of all 56 possible three-of-eight combinations are shown. (B and F) Stage 2: The hill-climbing results of estimating three fixed parameters for the best model (with Gaussian noise σ, sigmoidal steepness s, and forgetting rate γ fixed) are shown, with bigger circles and lighter colors indicating better goodness-of-fit; the 10 best hill-climbing points (biggest light yellow circles) were selected for evaluating averages of all their possible combinations. (C and G) Stage 3: The 10 combinations with the best goodness-of-fit (χ2) are displayed. Overall, 267 of 1,023 combinations had better χ2 than the best hill-climbing point (χ2 = 1.522) for the discovery sample, as did 77 of 1,023 combinations for the replication sample (χ2 = 1.507), suggesting that averaging parameters helps overcome gaps in step size and leads to refined parameter values. (D and H) Histograms of the best-fitting individual parameters show distributions with the following means: c = 1.95, α = 1.93, β = 1.27, εneg = 1.12, εpos = 1.09 for the discovery sample and c = 2.23, α = 2.04, β = 1.22, εneg = 1.13, εpos = 1.11 for the replication sample.

