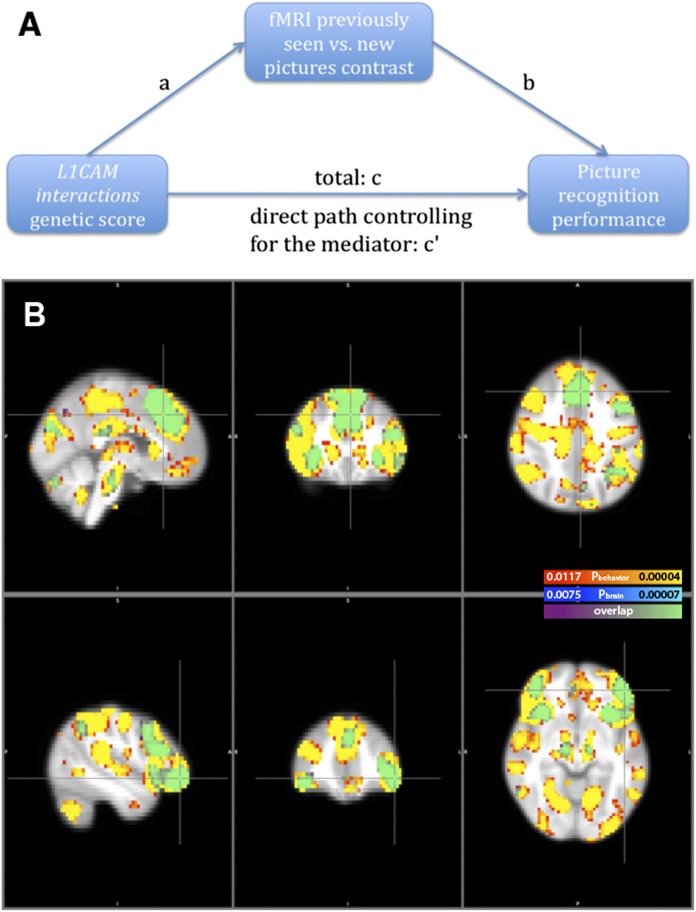
Fig. S3.
Scheme and results of the mediation analysis. (A) The overall predictor–outcome relationship is denoted as “c,” and the direct effect controlling for the mediator is denoted as “c′.” The a × b effect tests the significance of mediation (c–c′). For more details see Materials and Methods. (B) Mediation results at (−3, 28, 40) and (−47, 44, −8), depicting voxels for which the contrast in brain activation related to the previously seen vs. new pictures was considered a significant mediator of the relationship between the genetic score and recognition performance (blue scale), at a significance threshold of P(FDR) = 0.0075. The value of this threshold for whole-brain correction might be unusually high because of correlations between the genetic score and the behavioral phenotype. As a control, random shuffling of fMRI images between subjects was performed 10 times, always leading to no voxels surviving the FDR significance threshold. We also found that behavioral phenotype was a significant mediator of the relationship between the genetic score and differences in brain activity. Results are shown based on the red-to-yellow scale, superimposed on the original ones, at a significance threshold of P(FDR) = 0.0117. Effect sizes with neuroimaging and behavioral phenotypes as mediators were comparable in the four clusters associated with the genetic score. For the coronal and horizontal sections left in the picture refer to the right side of the brain and vice versa.

