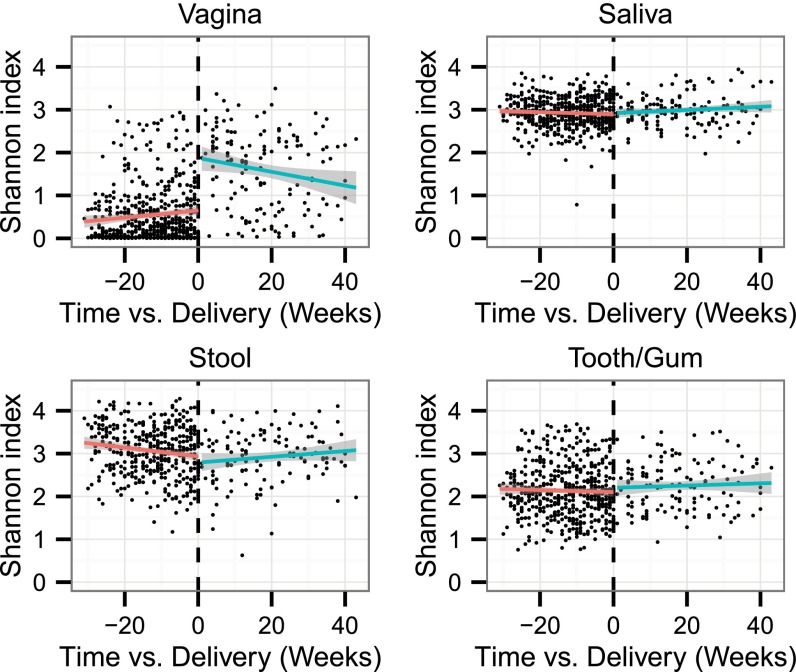
Fig. 5.
Alpha diversity pre- and postdelivery at each body site. The Shannon index is plotted versus the time at which each specimen was collected relative to delivery for the subjects in the first group of 40 subjects who provided at least one postdelivery sample. Linear fits are shown for the predelivery (red) and postdelivery (green) specimens, considered separately. Significant shifts to higher diversity were observed postdelivery in vaginal communities (P = 5.2 × 10⁻⁶ paired Wilcoxon test) and, to a lesser extent, in the tooth/gum communities (P = 0.014) but not in saliva or stool.

