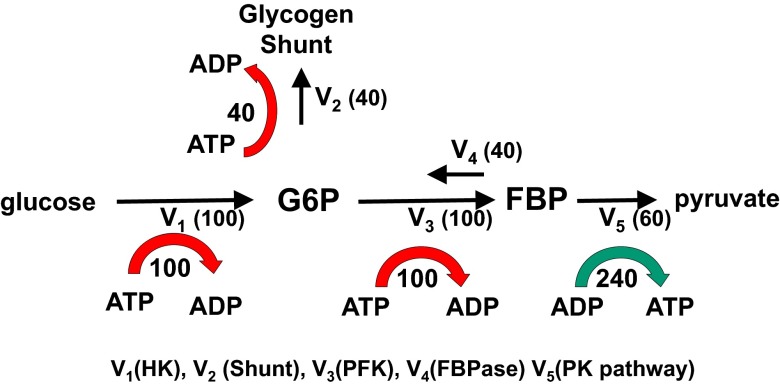
Fig. 2.
The glycogen shunt maintains ATP, G6P, and FBP homeostasis. The diagram shows the relative fluxes calculated for glycolytic pathway, futile cycling, and the glycogen shunt required to maintain glycolytic intermediate and ATP homeostasis. The rate of ATP production or consumption for HK (V1), glycogen shunt (V2), PFK (V3), and the PK segment of glycolysis (V5) are shown. Comparison with Fig. 1 shows that within measurement error, the relative fluxes measured in yeast under aerobic conditions are the same as the theoretical ideal values. The red arrows indicate the consumption of ATP by the demand portion of the pathway, and the green arrow indicates production by the supply portion. Adding the supply and demand together shows that there is no net production or consumption of ATP in the system.

