Fig. S1.
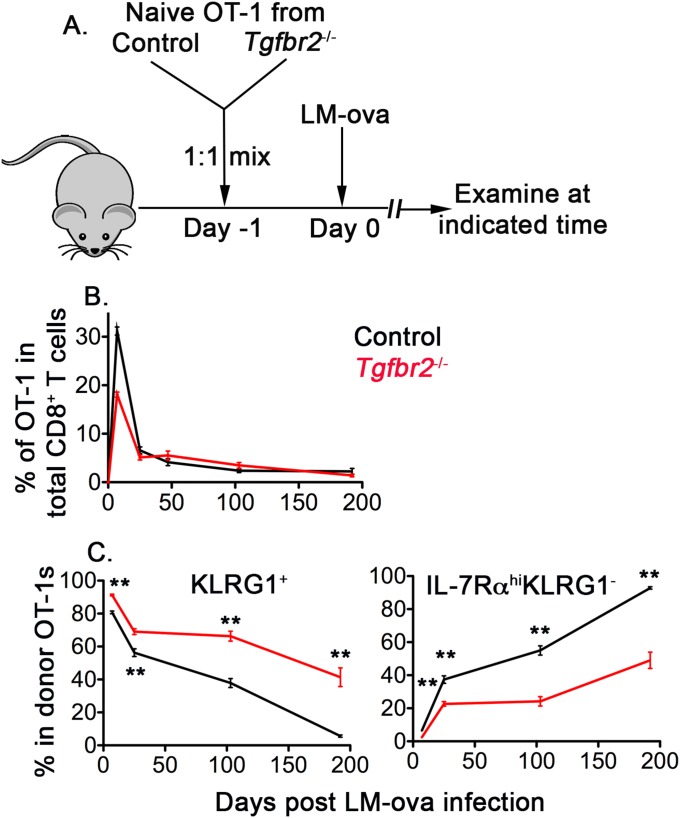
Aberrant effector and memory T-cell differentiation in the absence of TGF-β signaling. (A) Schematic of the experiments. Naïve OT-1 T cells were purified from congenically marked control and Tgfbr2−/− mice and mixed at a 1:1 ratio. Then 104 mixed OT-1 cells were transferred into each B6 recipient mouse, followed by infection with 2,000 cfu of LM-ova administered i.v. on day 2. OT-1 T-cell response in the peripheral blood and spleen was measured by flow cytometry at different time points. (B) Percentages of control and Tgfbr2−/− OT-1 T cells in total CD8+ T cells. (C) Percentages of KLRG1+ (Left) and IL-7Rα+KLRG1− (Right) populations within OT-1 T cells. Combined results from five or six independent experiments are shown in B and C. **P < 0.01, Student t test.

