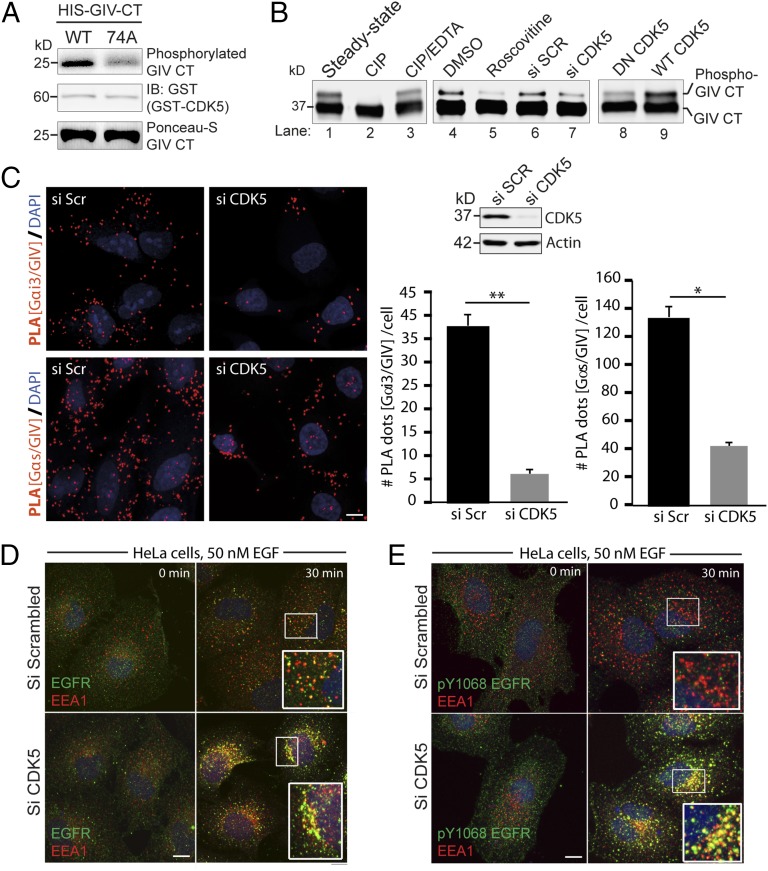
Fig. 4.
CDK5 phosphorylates GIV at S1674. (A) In vitro kinase assays were carried out on bacterially expressed and purified His-GIV-CT (WT) or nonphosphorylatable 74A mutant with recombinant CDK5 kinase in the presence of [32P]ATP followed by autoradiography (Upper). Equal loading of active kinase and His-GIV-CT substrate was analyzed by immunoblotting (Middle) and Ponceau-S staining (Lower), respectively. (B) GST-GIV CT 1660–1736 expressed in Cos7 cells was subjected to different treatments as indicated and analyzed by immunoblotting using anti-GST antibody. The faster migrating form of the doublet represents the unmodified form, and the slower migrating form represents the phosphorylated form of GIV-CT 1660–1736 as determined by treatment of bead-bound GIV-CT with calf intestinal phosphatase (CIP) (lanes 1–3). CDK5 inactivation using Roscovitine (lanes 4 and 5), siRNA mediated depletion (lanes 6 and 7), and expression of a dominant negative (DN) form of CDK5 (lanes 8 and 9) reduced phosphorylation of GIV-CT 1660–1736. (C) Control or CDK5-depleted HeLa cells were fixed and analyzed for interactions between GIV and Gαi3 (Upper Left) or GIV and Gαs (Lower Left) by in situ PLA (red). Nuclei, DAPI (blue). Whole cell lysates of HeLa cells used for PLA assays were analyzed for efficiency of CDK5 depletion by immunoblotting (Upper Right). PLA dots were quantified per cell from a total of 25–30 cells per experiment (Lower Right). Results are expressed as mean ± SEM; n = 3. (D and E) Serum-starved control (si Scr) or CDK5-depleted (si CDK5) HeLa cells were stimulated with 50 nM EGF, fixed, and stained for total EGFR (green; D) or pY1068-EGFR (green; E), EEA1(red), and DAPI (nucleus; blue), and analyzed by confocal microscopy as in Fig. 2A. Yellow pixels, indicative of total (D) and active EGFR (E) in endosomes were increased ∼2.8-fold in D and ∼8.3-fold in E, respectively, as determined using ImageJ. (Scale bar, 10 μm.)

