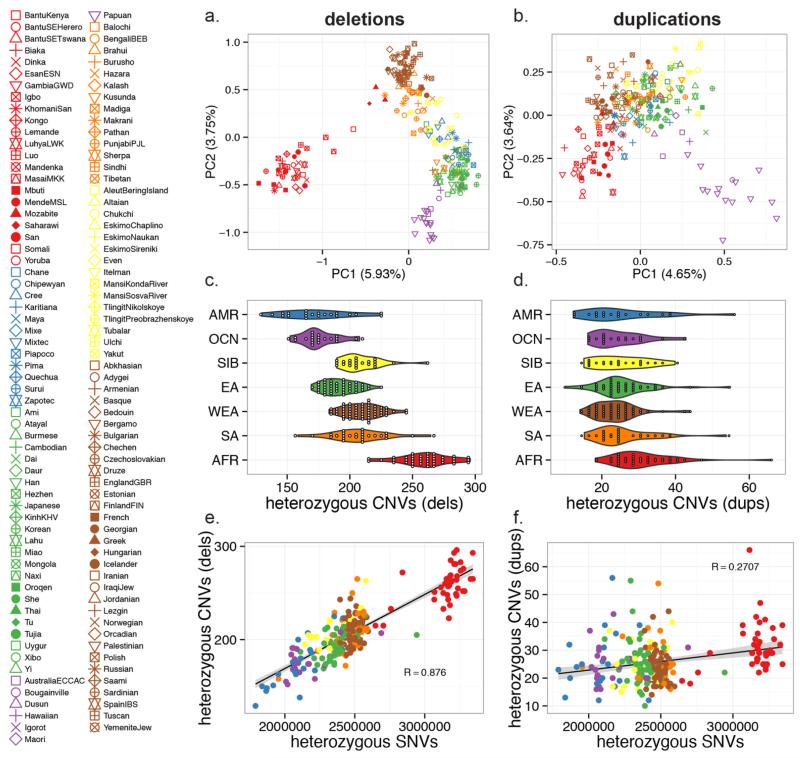
Fig. 2. Population structure and CNV diversity.
Principal component analysis (PCA) of individuals assessed in this study plotted for bi-allelic deletions (A) and duplications (B) with colors and shapes representing continental and specific populations, respectively. Individuals are projected along the PC1 and PC2 axes. The deletion (C) and duplication (D) heterozygosity plotted and grouped by continental population. The relationship between SNV heterozygosity and deletion (E) or duplication (F) heterozygosity is compared.

