Figure 5.

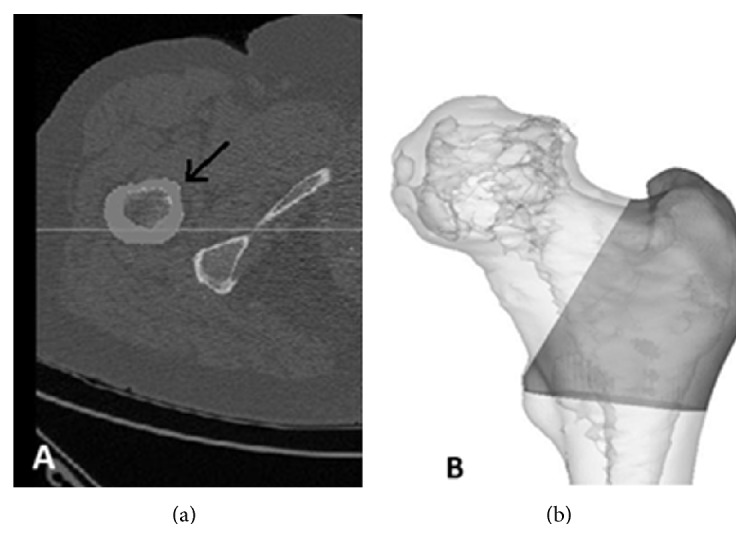
(a) Axial view of one slice of the CT-data from a patient. The arrow points to the area belonging to the mask. (b) The 3D view of the region of interest for BMD calculations.

(a) Axial view of one slice of the CT-data from a patient. The arrow points to the area belonging to the mask. (b) The 3D view of the region of interest for BMD calculations.