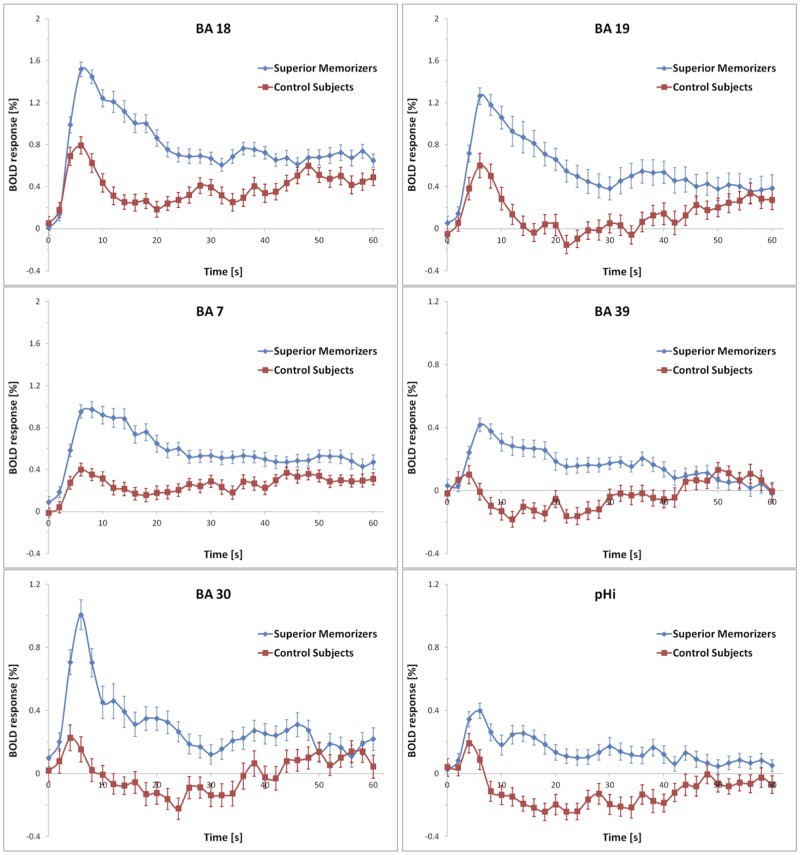
FIGURE 6.
Averaged BOLD responses of the brain areas showing encoding-specific activation in superior memorizers. Time point zero denotes the start of the encoding condition that lasted for 60 s. The baseline (0 % BOLD response) was defined as the average response within 4 s prior to the encoding condition. Note the different scaling of the ordinates. The BOLD response of control subjects is depicted for comparison.

