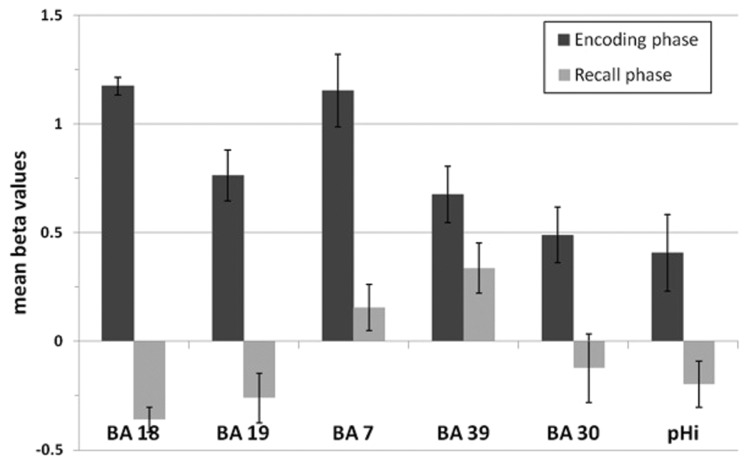
FIGURE 7.
Mean beta values of the encoding-specific areas of superior memorizers shown in Figure 5. Beta values of the encoding phase correspond to the BOLD response of the superior memorizers depicted as blue curve in Figure 6. The beta values of the recall phase are all significantly lower than those of the encoding phase (BA 18, BA 19, BA 7, BA 30, and pHi: p < 0.01; BA 39: p < 0.05; two sides t-test).

