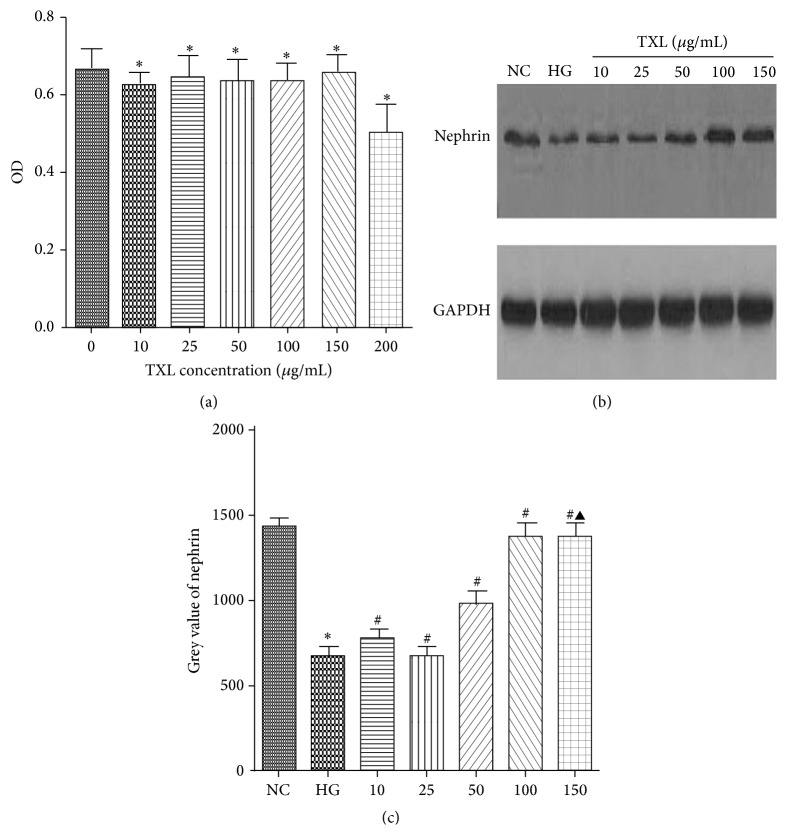
Figure 1.
The cytotoxicity and optimum concentration of TXL for cultured podocyte. (a) Comparison of OD in cultured podocyte. The result showed that, compared with control, the OD had not significantly changed with TXL at the concentrations of 10, 25, 50, 100, and 150 μg/mL (P > 0.05); the OD was significantly decreased with TXL at the concentration of 200 μg/mL (P < 0.05). (b) Representative band of nephrin protein by western blot in cultured podocyte. (c) Comparison of the grey value of nephrin protein in cultured podocyte (n = 3). The result showed that nephrin protein was statistically significantly decreased in HG group compared with NC group (P < 0.05). TXL at the concentrations of 10 μg/mL and 25 μg/mL had no effect on nephrin expression compared with HG group (P > 0.05). Nephrin expression began to be increased in high glucose cultured podocyte when TXL concentration was added to 50 μg/mL (P < 0.05). Nephrin expression was peaked at TXL concentration of 100 μg/mL (P < 0.05). When TXL concentration was added to 150 μg/mL, nephrin expression had no change compared with the group treated with 100 μg/mL (P > 0.05). ∗ P < 0.05 versus NG. # P < 0.05 versus HG. ▲ P < 0.05 versus TXL (100 μg/mL).

