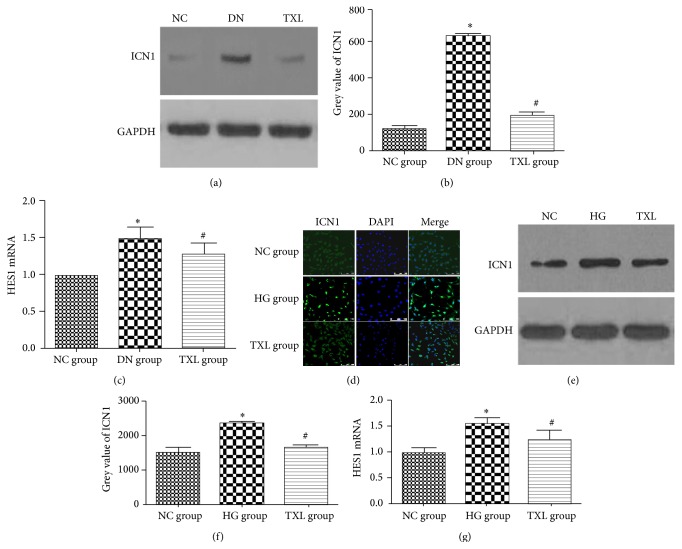
Figure 3.
Effect of TXL on notch pathway in diabetic rats and high glucose cultured podocyte. (a) Representative band of ICN1 protein by western blot in rats. (b) Comparison of the grey value of ICN1 protein in rats (n = 3). The result showed that ICN1 protein was statistically significantly increased in DN group compared with NC group (P < 0.05). ICN1 protein expression was significantly decreased in TXL group compared with DN group (P < 0.05). (c) Comparison of mRNA level of HES1 by RT-PCR in rats (n = 3). The result showed that HES1 mRNA was statistically significantly increased in DN group compared with NC group (P < 0.05). HES1 mRNA expression was significantly decreased in TXL group compared with DN group (P < 0.05). (d) Representative photograph of ICN1 staining (green) and cell nucleus (DAPI blue). High glucose increased ICN1 expression and promoted ICN1 translocation from cytoplasm to nucleus, and TXL inhibited ICN1 expression and nuclear translocation. (e) Representative band of ICN1 protein by western blot in cultured podocyte. (f) Comparison of the grey value of ICN1 protein in cultured podocyte (n = 3). The result showed that ICN1 protein was statistically significantly increased in HG group compared with NC group (P < 0.05). ICN1 protein expression was significantly decreased in TXL group compared with HG group (P < 0.05). (g) Comparison of mRNA level of HES1 by RT-PCR in cultured podocyte (n = 3). The result showed that HES1 mRNA was statistically significantly increased in HG group compared with NC group (P < 0.05). HES1 mRNA expression was significantly decreased in TXL group compared with HG group (P < 0.05). ∗ P < 0.05 versus NG. # P < 0.05 versus HG.

