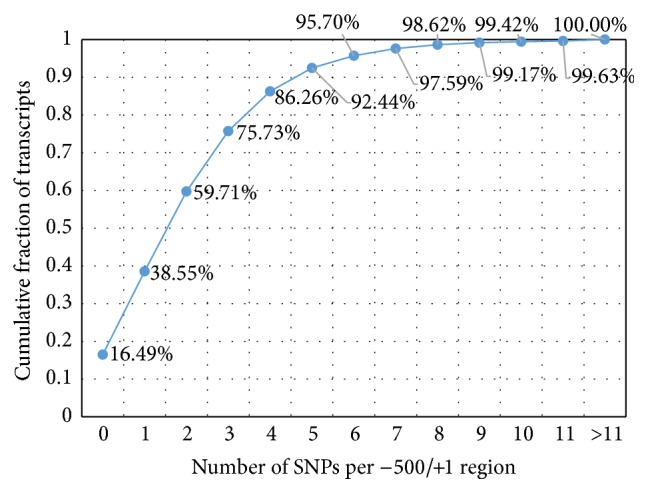
Figure 1.

Cumulative percentage plot for the fraction of human transcripts from the whole-genome dataset, possessing certain numbers of SNPs in their 500 bp long regions upstream annotated transcription start sites. x-axis denotes the threshold SNP content in 500 bp upstream TSS. y-axis denotes the cumulative fraction of the whole-genome dataset of transcripts.
