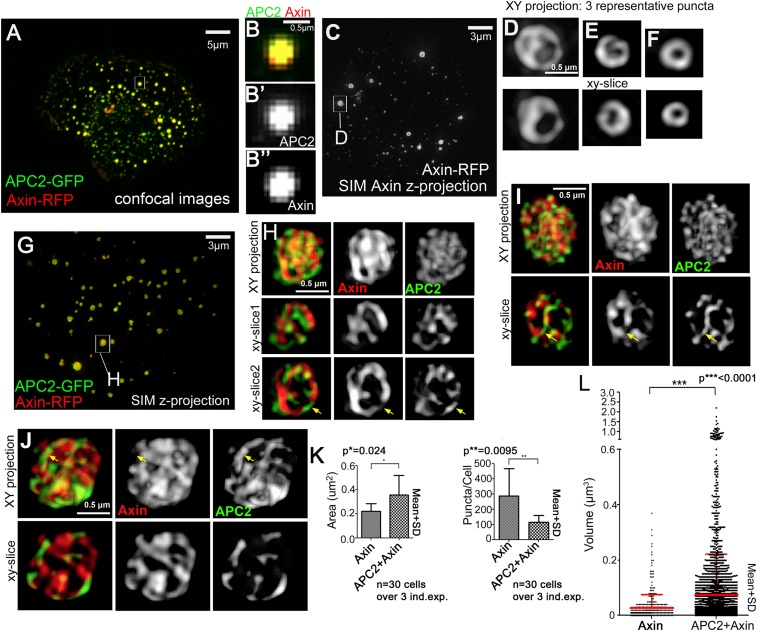
Figure 2. Axin and APC2 form structured macromolecular complexes in vivo.
SW480 cells. (A) Confocal image, GFP-APC2 and Axin-RFP. APC2 is recruited into Axin puncta. (B) Closeups, showing failure to resolve internal structure. (C–J) SIM super-resolution. (C) Axin-RFP alone. (D–F) Closeups, Axin complexes from different cells. D = punctum boxed in C. Axin cables assemble into spheres/sheets. (G) Cell coexpressing GFP-APC2 and Axin-RFP. (H–J) Closeups of APC2:Axin complexes from different cells. H = punctum boxed in G. Axin cables increase in complexity and APC2 forms cables intertwined with Axin (arrows). (K) Analysis of confocal images. Complexes formed by APC2 and Axin average nearly twice the cross-sectional area of complexes formed by Axin alone (left). Axin-expressing cells have twice as many complexes as cells coexpressing APC2 + Axin (right). Student's t-test. (L) Puncta volume in Axin expressing cells (n = 3) vs APC2 + Axin expressing cells (n = 11) showing volumes across puncta population. Volume differences expressing cells are consistent with area quantification in (K). ANOVA-Bonferroni was used.

