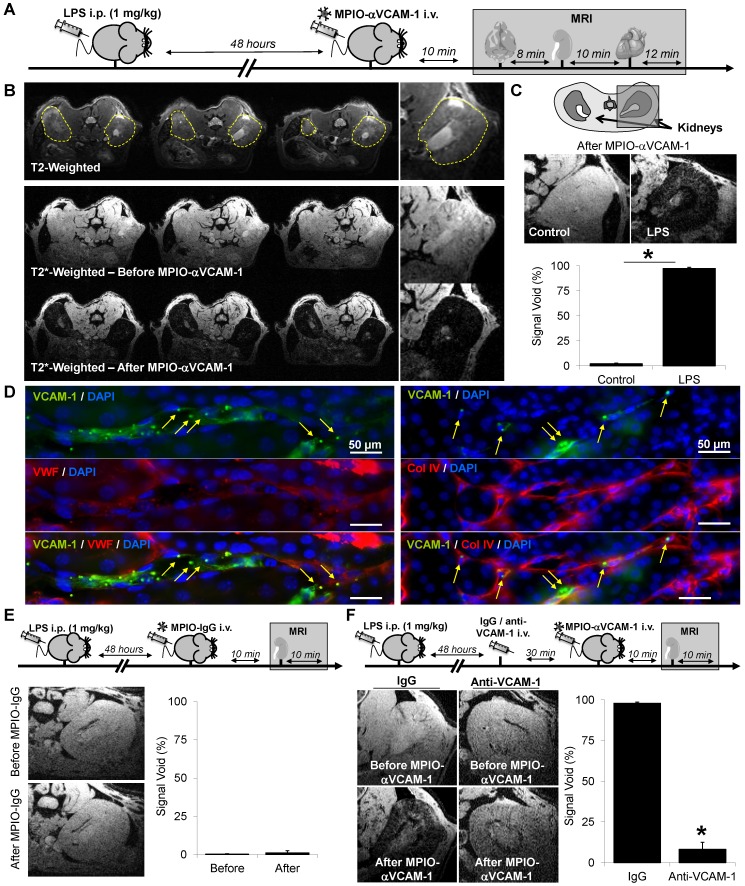
Figure 1.
MPIO-αVCAM-1 enhanced MRI reveals endothelial activation in the kidney during systemic inflammation. (A) Schematic representation of the experimental design. (B) Top, Representative consecutive slices (from a single mouse) from T2-weighted images of the kidney from LPS-treated mice (1 mg/kg) revealing no apparent abnormality. Middle, representative T2*-weighted images of the kidney from LPS-treated mice (1 mg/kg) before MPIO-αVCAM-1 administration. Bottom, same as middle but after MPIO-αVCAM-1 administration, revealing numerous confluent signal voids in both kidneys (dark areas). (C) Top, Representative consecutive slices (from a single mouse) from T2*-weighted images from control and LPS-treated mice (1 mg/kg) after MPIO-αVCAM-1 administration. Bottom, corresponding quantification (n=3/group).*p<0.05 vs control/saline. (D) Immunohistological images of MPIO-αVCAM-1 in kidneys from LPS-treated mice. Green represents VCAM-1, Red represents collagen type IV or von Willebrand factor (both used as endothelial markers) and Blue represents DAPI. The yellow arrows indicate MPIO-αVCAM-1 localization (autofluorescent green dots). (E) Top: Experimental design. Left: Representative T2* weighted images of the right kidney of LPS-treated mice before (top) and after (bottom) MPIO-IgG injection. Right: Corresponding quantification (n=4/group). ns= non-significant (F) Top: Experimental design. Left: Representative T2* weighted images of the right kidney of LPS-treated mice before (top) and after (bottom) MPIO-αVCAM-1 injection. All mice were pre-treated with either control IgG or anti-VCAM-1 IgG (2.5 mg/kg, competition experiment). Right: Corresponding quantification (n=5/group).

