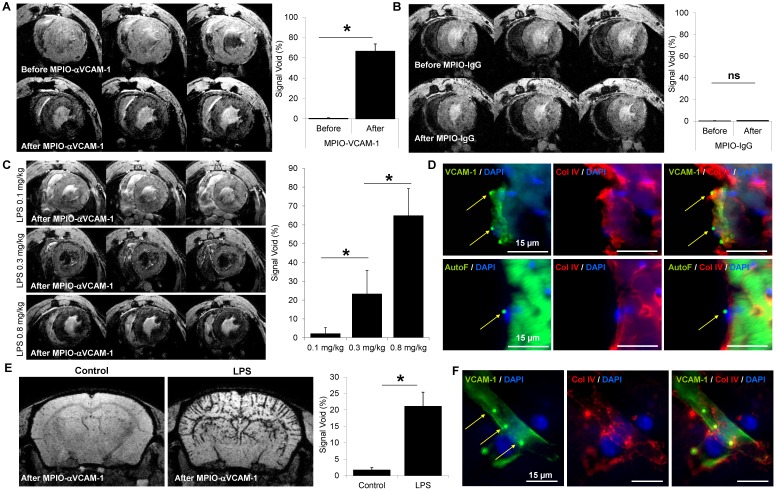
Figure 3.
A single MPIO-αVCAM-1 injection allows multi-organ mapping of endothelial activation: examples of the brain and the heart. (A) Left: Representative consecutive slices (from a single mouse) from T2*-weighted images of the heart from LPS-treated mice (1 mg/kg) before (top) and after (bottom) MPIO-αVCAM-1 administration. Right: Corresponding quantification (n=4/group). (B) Left: Representative consecutive slices (from a single mouse) from T2* weighted images of the heart of LPS-treated mice before (top) and after (bottom) MPIO-IgG injection. Right: Corresponding quantification (n=4/group). (C) Left: Representative consecutive slices (from a single mouse) from T2*-weighted images of the heart from LPS-treated animals at different weight-adjusted doses (0.1, 0.3 and 0.8 mg/kg) 20 minutes after MPIO-αVCAM-1 injection. Right: Corresponding quantification (n=4/group). *p<0.05 vs lower dose. (D) Representative images of MPIO-αVCAM-1 inside the endocardium (Top) or VCAM-1+ vessels (Bottom) of the heart as seen by immunofluorescence. The yellow arrows indicate MPIO-αVCAM-1 localization (MPIOs are fluorescent in green). (E) Left: Representative T2*-weighted images of the brain from control and LPS-treated mice (1 mg/kg) after MPIO-αVCAM-1 administration. Right: Corresponding quantification (n=3/group). (F) Representative images of MPIO-αVCAM-1 inside a VCAM-1+ vessel of the brain as seen by immunofluorescence.

