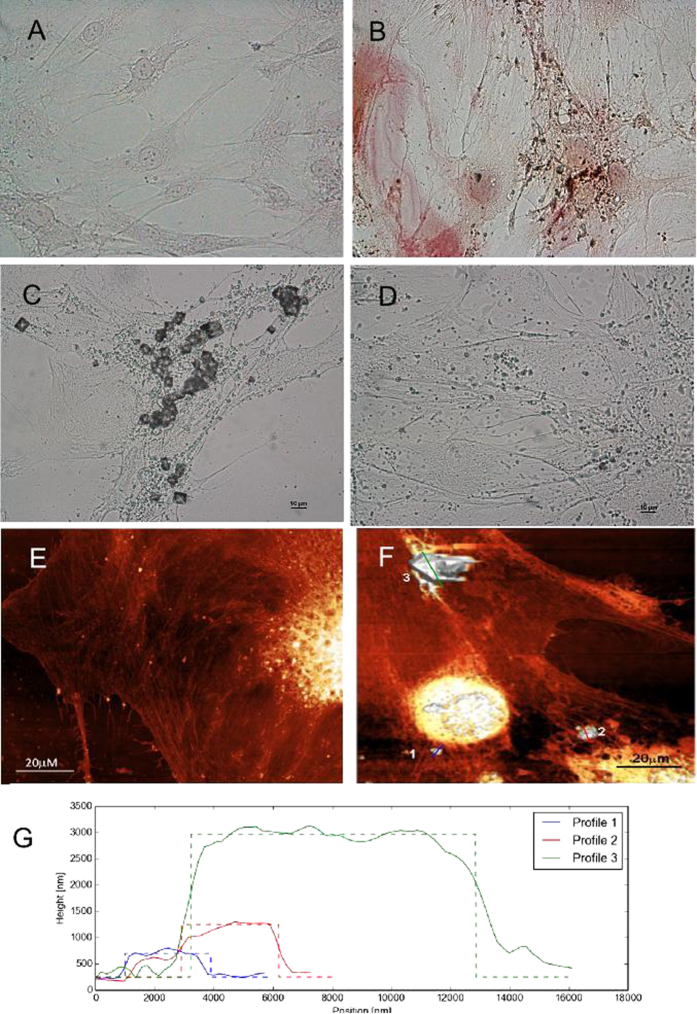
Figure 2. Osteo-differentiation of BM-hMSCs.
(A,B) Alizarin Red staining: (A) ODM−/PEMF−; (B) ODM+/PEMF− BM-hMSC cells. Red precipitates accumulate in correspondence with calcium produced by the cells. Selected images are representative of three independent experiments. Similar results were also obtained in ODM+/PEMF+. (C,D) Different quantities of aggregates of various sizes are detectable in the culture medium and on the cell surface after 27 days of ODM+ (C) or ODM+/PEMF+ treatment (D). (E–G) AFM analysis: AFM contact mode images of ODM−/PEMF− (E) and ODM+/PEMF− (F) Special structures are identified by numbers and the corresponding profiles are reported in panel (G). The bars are 20 μm long. Images were obtained in air environment.

