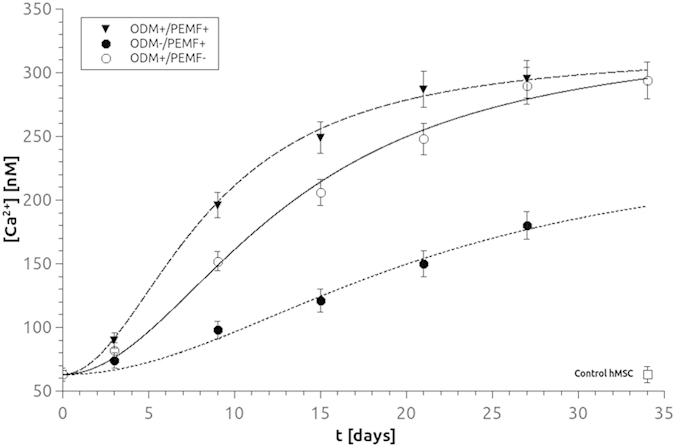
Figure 7. Estimation of intracellular level of [Ca2+]i: effects of ODM treatment and PEMF exposure for BM-hMSCs grown up to 34 days.

Mean time-response curves obtained from ODM+ /PEMF+ (▼), ODM−/PEMF+ (●), or ODM+/PEMF− (○) samples indicate a synergistic effect deriving from the simultaneous application of the two treatments. As a negative reference, the value of BM-hMSC cells grown 34 days in MM (ODM−/PEMF− (⬜) is shown. Each point represents the mean of 3–6 distinct experiments. Data fits have been performed according to equation [3] (see text, Material and Methods section).
