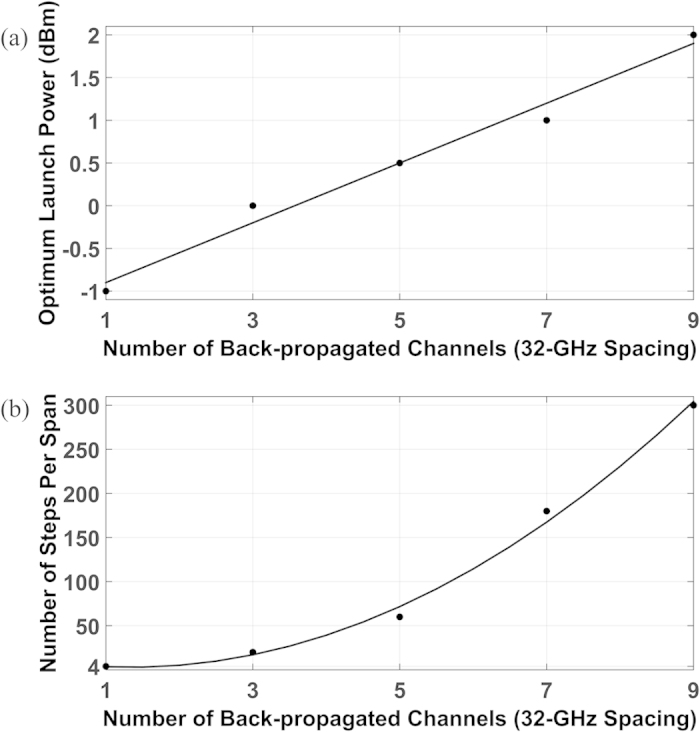
Figure 8. Optimization of MC-DBP for different numbers of back-propagated sub-channels.

(a) shows the optimum optical launch power per sub-channel versus the number of back-propagated sub-channels in MC-DBP; (b) shows the minimum required number of steps per fibre span in MC-DBP versus the number of back-propagated sub-channels. The markers are the simulation data, and the solid lines are the linear fit in (a), and the second-order polynomial fit in (b), respectively.
