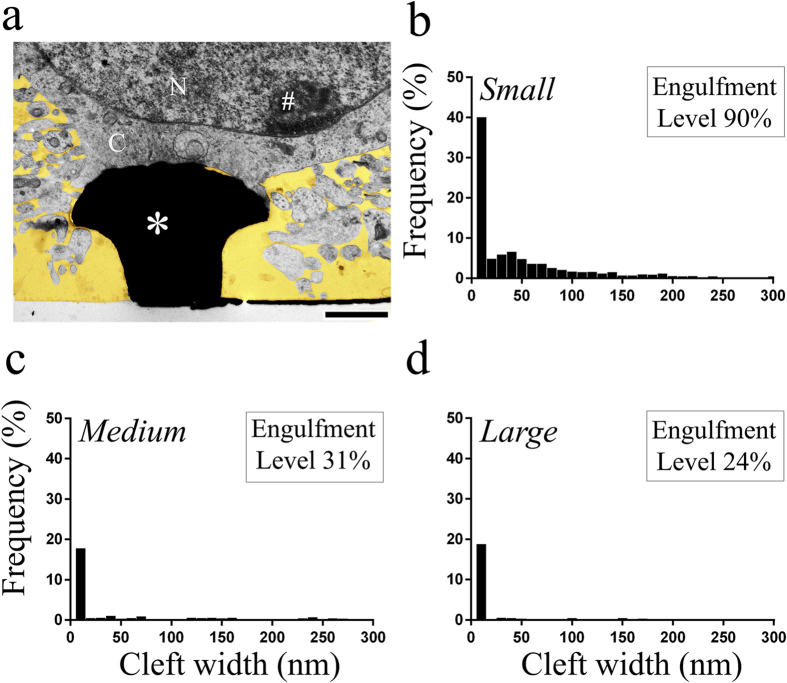
Figure 4. The average frequency (%) of the cleft width (nm) between the surface of gMμPs and the plasma membrane of cultured neurons.
The values of the engulfment levels are indicated in the graphs. (a) An example of a TEM image from which the cleft width measurements were made. (b) Small gMμPs. (c) Medium size gMμPs and (d) Large gMμPs. (a). *- gMμPs, N- nucleus, C- cytoplasm, #- chromatin. For additional details see Supplementary Figs. 2–4.

