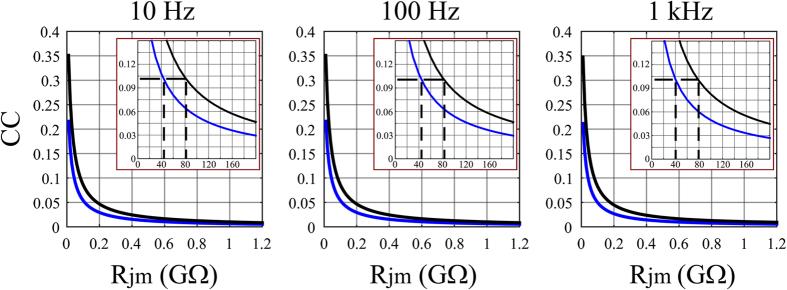
Figure 7. The CC as a function of the junctional membrane resistance (Rjm) for gMμEs with cap diameters of 1.5 μm (lower curve, blue) and 2.5 μm (upper curve, black), cleft thickness of 25 nm.

Inserts: enlargements of the relationships between the CC and Rjm in MΩ. The dashed lines in the inserts indicate that at Rjm ≤ 40–80 MΩ the CC levels reach values ≥ 10%, enabling to record subthreshold synaptic potentials.
