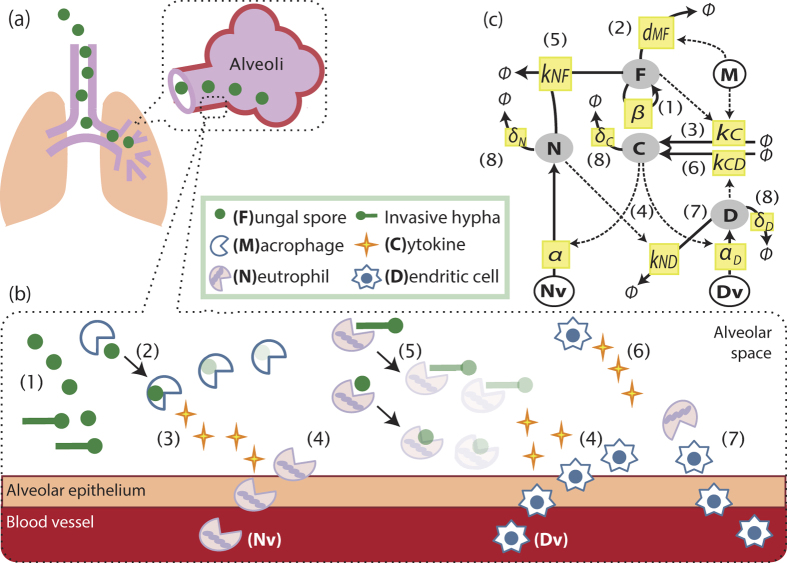
Figure 1. Host-pathogen interaction model.
(a,b): Cartoon model of fungal exposure and killing for A. fumigatus and (c) a diagram for cellular interactions. Processes included in the model are: (1) Proliferation of fungal nuclei, leading to increased fungal burden (F), (2) Macrophage (M)-mediated fungal killing, (3) Production of cytokines (C) by macrophages, (4) Cytokine-induced recruitment of lung dwelling neutrophils (N) and inflammatory dendritic cells (D), from the neutrophil pool (Nv) or dendritic cell source (Dv), (5) Fungal killing by neutrophils, (6) Production of cytokines by inflammatory dendritic cells, (7) Neutrophil-mediated efflux of inflammatory dendritic cells, and (8) Degradation of cytokines, inflammatory dendritic cells and neutrophils (only shown in the diagram in (c)). (c) Variables in our model (F, C, N, D) are shown in shaded circles, whereas fixed parameters (M, Nv, Dv) are in black circles. Each process is shown by a yellow box with its parameter notation for the corresponding equation. Solid and dotted lines indicate the physical involvement of the process and the modulation of the rate of the process, respectively.

