
Figure 2.
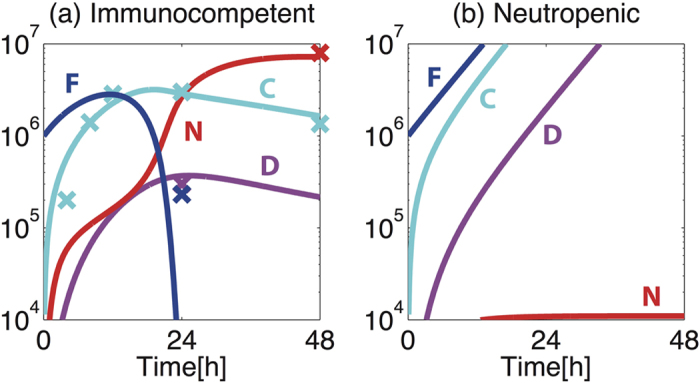
Simulated short-term dynamics of response to A. fumigatus challenge in (a) immunocompetent and (b) neutropenic hosts. Blue, cyan, red and pink depict fungal burden (F, [106 CEs]), cytokines (C, [ng/ml]), recruited neutrophils (N, [106 cells]) and recruited iDCs (D [106 cells]), respectively. Solid lines represent model time-course and crosses represent the experimental data points used for parameter estimation20,24.