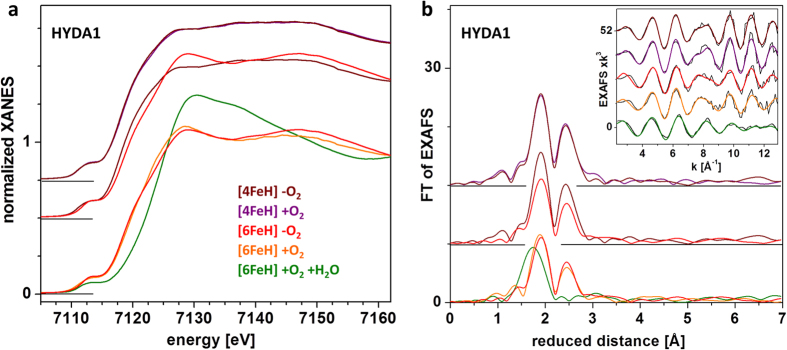
Figure 4. Fe-XAS analysis of lyophilized HYDA1 proteins.

(a) XANES spectra of the indicated [FeFe]-hydrogenase samples. (b) Fourier-transforms (FTs of experimental data) of EXAFS spectra in the inset (black lines, experimental data; colored lines, simulations with parameters in Table 1). The color code is the same and spectra were vertically displaced for comparison in panels (a and b).
