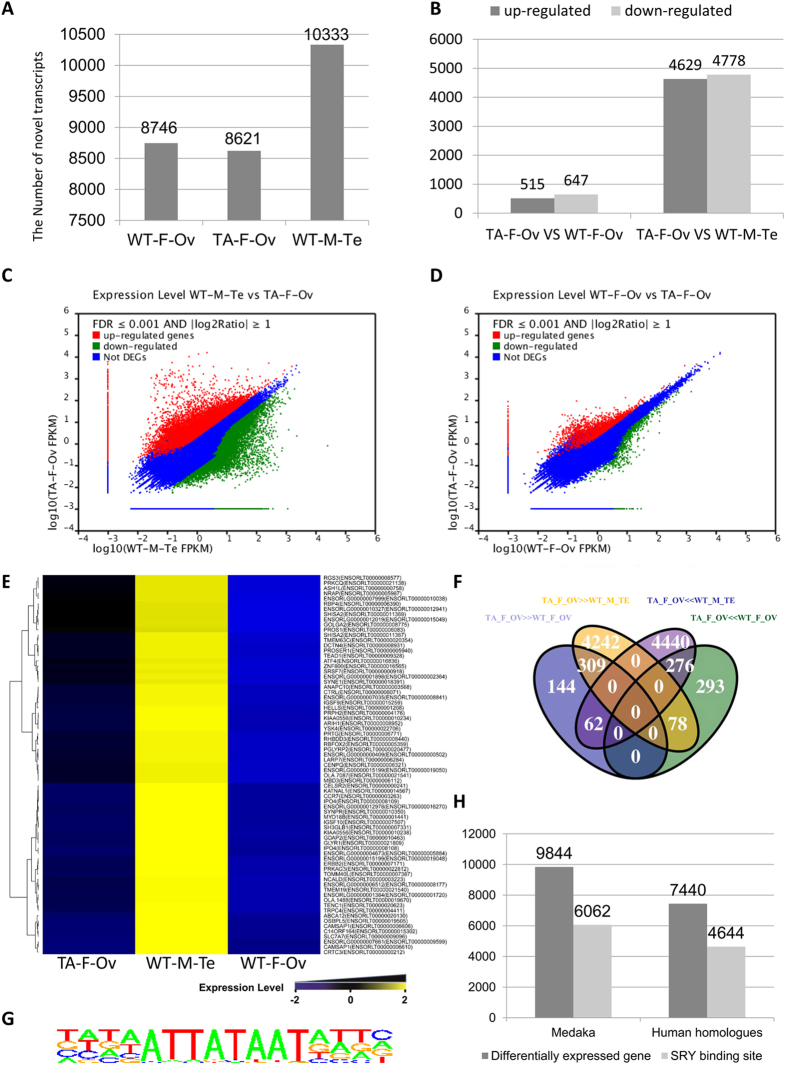
Figure 6. Bioinformatic analyses of RNA-seq data.
(A) The number of novel transcripts in the RNA-seq data the WT female (WT_F_OV), the wild-type male (WT_M_Te) and XYDMY− female medaka (TA_F_OV). (B) The differentially expressed transcripts between TA_F_OV and WT_F_OV/WT_M_Te. (C) Correlation of gene expression between WT_M_Te and TA_F_Ov. The up- and downregulated genes are shown in red and green, respectively. Non-differentially expressed genes are shown in blue. (D) Correlation of gene expression between WT_F_Ov and TA_F_Ov. The up- and downregulated genes are shown in red and green, respectively. Non-differentially expressed genes are shown in blue. (E) The cluster of testis-specific expressing transcripts. Cluster analyses of differentially expressed genes among WT_F_Ov, WT_M_Te and TA_F_Ov. The high- and low-expressed genes are shown form yellow to blue, corresponded to the expression level from negative 2 fold to positive 2 fold. (F) The differentially expressed transcripts among TA_F_Ov, WT_F_Ov and WT_M_Te. The up- and downregulated genes in WT_M_Te were shown in Fuchsia and yellow, respectively. The up- and downregulated genes in WT_F_Ov are shown in green and purple, respectively. TA_F_Ov ≫ WT_F_Ov means the genes were upregulated in TA_F_Ov. TA_F_Ov ≪ WT_F_Ov means the genes were downregulated in TA_F_Ov. TA_F_Ov ≫ WT_M_Te means genes were upregulated in TA_F_Ov. TA_F_Ov ≪ WT_M_Te means the genes were downregulated in TA_F_Ov. (G) SRY binding sites. (H) The SRY binding sites analyses of differentially expressed genes among TA_F_Ov, WT_F_Ov and WT_M_Te.

