Figure 3.
Refinement of P. patens MIRNA Annotations and Functions.
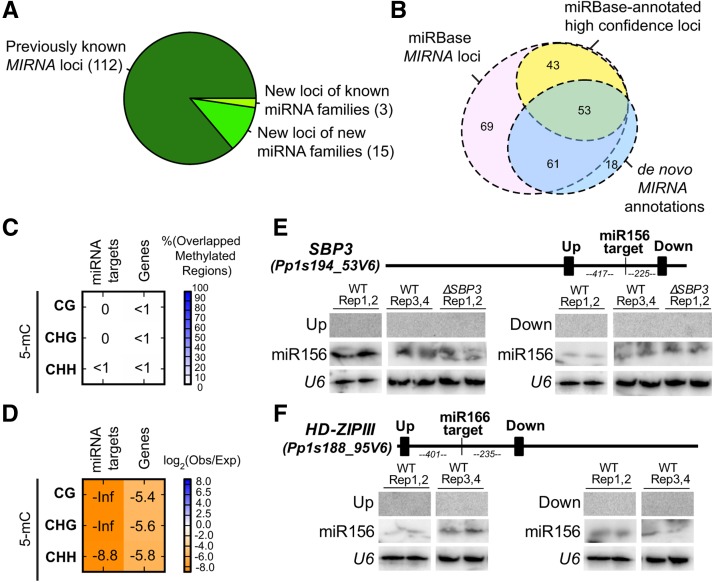
(A) Classification of MIRNA loci confidently identified in this study.
(B) Euler diagram comparing our de novo MIRNA annotations with previously annotated P. patens MIRNA loci from miRBase 21.
(C) Percentage overlaps of regions of dense DNA methylation with miRNA targets and P. patens genes. Calculated as in Figure 2A.
(D) Enrichment/depletion analysis of methylated regions of genome with miRNA targets and P. patens genes. Calculated as in Figure 2C.
(E) RNA gel blot of small RNAs surrounding miR156 target site in Pp SBP3. Filled rectangles on the gene schematic indicate probe positions. Up, upstream of target site; down, downstream of target site.
(F) RNA gel blot of small RNAs surrounding miR166 target site in HD-ZIPIII. Filled rectangles on the gene schematic indicate probe positions. Numbers indicate distances (nucleotides) between target sites and probed regions. Up, upstream of target site; down, downstream of target site.

