Figure 7.
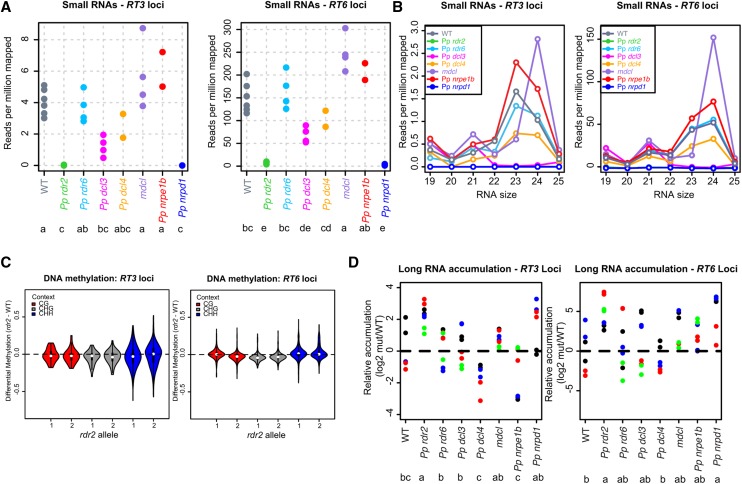
Effects of the P. patens Heterochromatic siRNA Pathway on the LTR Retrotransposon-Related Sequences RT3 and RT6.
(A) Overall small RNA abundance at RT3 and RT6 loci. Each dot represents a biological replicate small RNA-seq sample. Genotypes sharing a letter have means that are not significantly different (Tukey's honestly significant difference test, α = 0.05).
(B) Small RNA abundance by size within RT3 loci and RT6 loci for the indicated genotypes. Reads for all biological replicates within each genotype were summed and converted to reads per million mapped.
(C) Differential DNA methylation between the indicated Pp rdr2 alleles and the wild type at RT3 loci (left) and RT6 loci (right). Violin plots show a Tukey box plot (line = median, box edges = 1st and 3rd quartiles, whiskers = 1.5 IQR) surrounded by a twinned kernel density plot to visually show the distribution of the data.
(D) Long RNA accumulation based on quantitative RT-PCR from RT3 loci (left) and RT6 loci (right). Dots of the same color represent different technical replicates of the same biological replicate. Genotypes sharing a letter have means that are not significantly different (Tukey's honestly significant difference test, α = 0.05).

