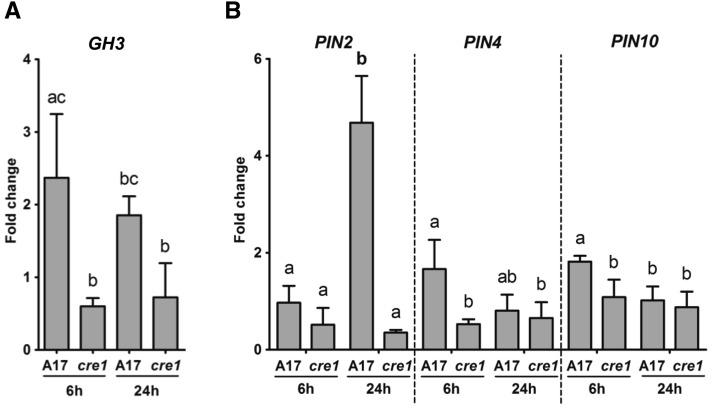
Figure 4.
RT-qPCR Showing Transcript Abundance in Root Segments of the Wild Type (A17) and cre1 Mutants Inoculated for 6 and 24 h with E65 Relative to Mock-Treated Roots.
Expression was normalized to the GAPDh reference gene. The auxin response gene GH3 (A) and the IAA exporter-encoding genes PIN2, PIN4, and PIN10 (B) were analyzed. A two-way ANOVA with a Tukey-Kramer multiple comparison post-test was used for statistical analyses (P < 0.05, n = 3). Different lowercase letters indicate significant differences in transcript abundance within each gene. Each biological replicate consists of at least 50 root segments. Graphs show mean and sd.

