Figure 4.
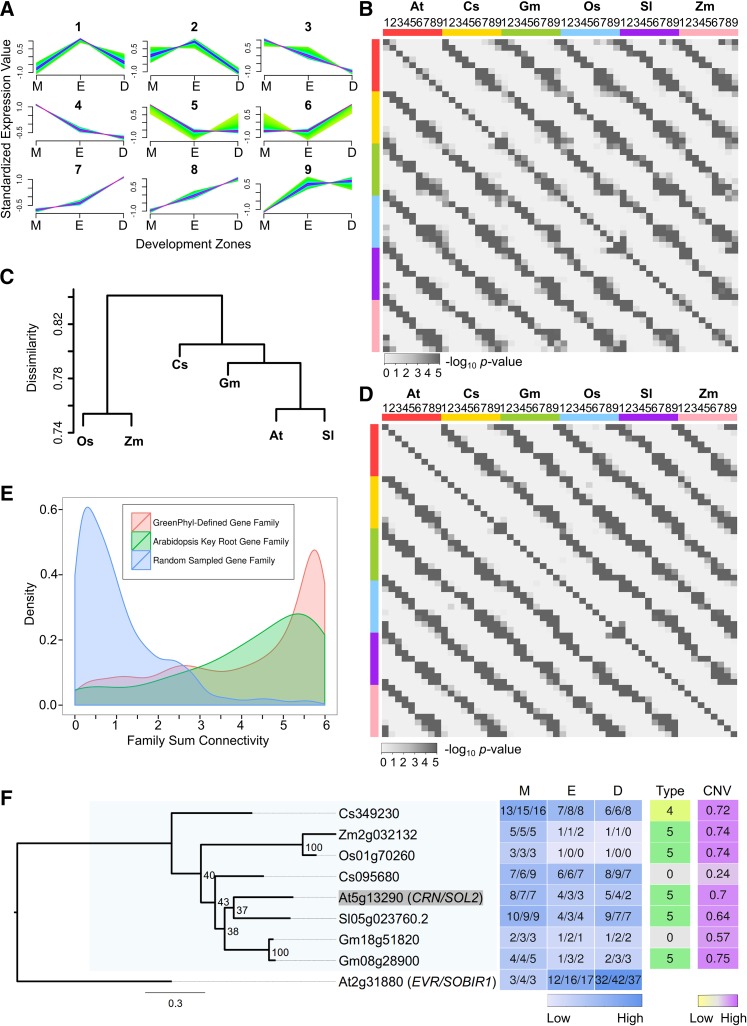
Comparison of Root Gene Expression across Angiosperms.
(A) Nine expression profile types in the MZ, EZ, and DZ assigned by fuzzy C-Means clustering. Gene expression with at least 2 FC between zones was standardized to have mean of 0 and sd of 1. High affinity to the cluster centroid is shown in purple and low in green.
(B) Heat map of corrected one-tail P values of pairwise Fisher's exact test for association of expression profile types (1 to 9) within gene families for each of the six species.
(C) Hierarchical clustering dendrogram based on the average dissimilarity ratio of gene families not sharing the same expression profile types.
(D) Heat map of corrected one-tail P values of pairwise Fisher's exact test for association of expression profile types (1 to 9) within supergene families for each of the six species.
(E) Density plot of family total connectivity, which summed the CNVs of the supergenes of each species within given families. Red, 6161 GreenPhyl-defined families with root-expressed supergenes from all six angiosperms; green, 73 GreenPhyl-defined families containing Arabidopsis known key root development genes; blue, 1000 gene families with randomly assigned member genes.
(F) Example of one of the 71 maximum likelihood phylogenetic trees reconstructed for relatives of Arabidopsis key root development genes. Tree reconstructed for Arabidopsis (At) CRN (shaded) and its relatives from rice (Os), maize (Zm), cucumber (Cs), tomato (Sl), and soybean (Gm). Also included is a heat map indicating gene expression in the three development zones (M, meristematic zone; E, elongation zone; D, differentiation zone) (values indicate FPKM), the gene expression profile types (Type), and CNVs. The well-defined CRN clade with family members from all of the angiosperm species is shaded in light blue.

