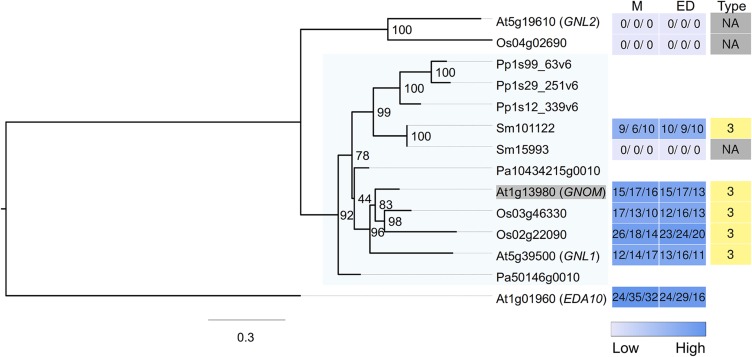
Figure 6.
Maximum Likelihood Tree Constructed for Relatives of Arabidopsis GNOM.
The gene expression level from the two development zones (M, meristematic zone; ED, combined elongation + differentiation zone) are shown as heat maps (values indicate FPKM), together with the expression FC type. The closely related Arabidopsis gene EDA10 was used as outgroup to root the tree. Expression FC types (1 to 5) for the genes are shown in different colors, whereas light gray indicates that no root expression was detected. The target gene (Arabidopsis GNOM) is shaded in gray, and the target clade with family members from all species is shaded in light blue. Related genes are also included from two species (Pa, Norway spruce; Pp, P. patens), which did not have their root expression assessed, indicated by blank spaces in the heat maps.

