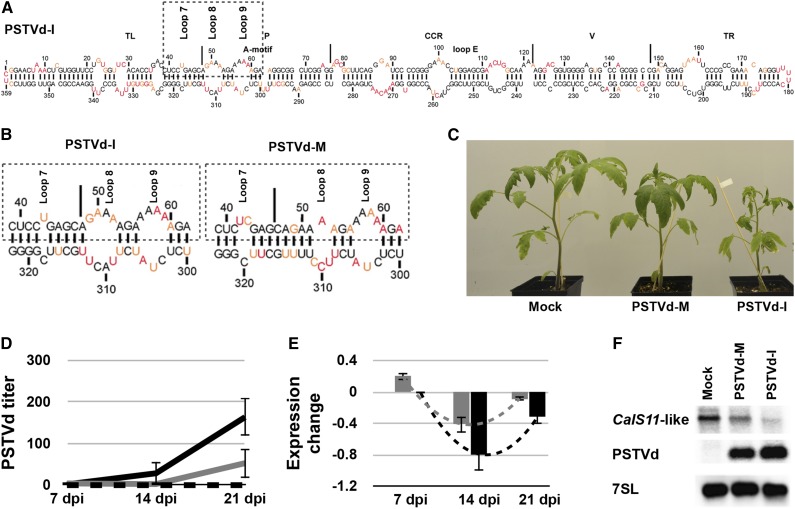
Figure 1.
Effect of the PSTVd Variants on the CalS11-like mRNA.
(A) The most stable predicted secondary structure for PSTVd-I generated using in solution mapping data obtained by SHAPE is shown. Low-reactivity nucleotides are indicated in black, and highly reactive nucleotides are shown in red. Intermediately reactive nucleotides are shown in orange. The structural/functional motifs of PSTVd-I are delimited by the vertical solid lines and are named accordingly. The A-motif and loop E are indicated.
(B) Enlarged structure at the VMR of both PSTVd-I and PSTVd-M. The boxed regions indicate the VMRs, which are often associated with the induction of symptoms in the bioassay. On the structures, loops 7, 8, and 9 are indicated.
(C) PSTVd variants exhibiting differences in the VMR were inoculated into tomato plants. At 14 dpi, PSTVd-M-inoculated plants showed slight stunting, compared with mock-inoculated plants, while PSTVd-I-inoculated plants showed both leaf curling and severe stunting.
(D) and (E) RNA extracted from tomato plants at 7, 14, and 21 dpi was used to monitor both the titer of PSTVd (D) and the expression of the CalS11-like mRNA (E) at different time intervals. The expression of the CalS11-like mRNA is presented in a log2 scale. In both graphs, the dotted black lines represent the mock-inoculated plants, while the gray and the black solid lines indicate the PSTVd-M- and PSTVd-I-inoculated plants, respectively. The changes in the expression levels of the CalS11-like mRNA between the time points are shown with dotted lines. Data represent the mean of three independent experiments, each performed in triplicate. Error bars indicate sd.
(F) Total RNA from plants infected as in (C) was extracted at 14 dpi and subjected to RNA gel blotting using probes against the CalS11-like mRNA and PSTVd, as well as the 7SL RNA as an internal control.

