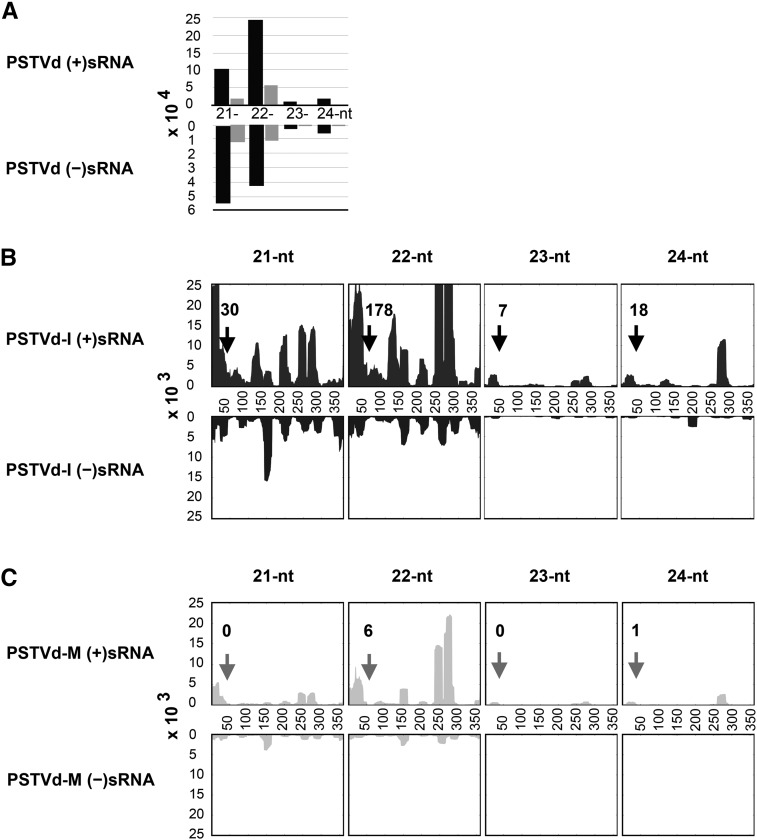
Figure 5.
Sequence Profile of the PSTVd-sRNAs Recovered from Infected Tomato Leaves.
(A) Size distribution of PSTVd-sRNAs. The horizontal axis indicates the lengths of the sRNA, and the vertical axis indicates the total number of sRNA reads. The black bars indicate PSTVd-I and the gray bars PSTVd-M.
(B) and (C) Profiles of the PSTVd-sRNA populations recovered from leaf tissues of tomato plants infected with PSTVd-I (B) and PSTVd-M (C). The upper panel shows the profile of the PSTVd-sRNAs derived from the genomic strand (+), and the lower panel presents those from the antigenomic strand (−). The regions of the vd-sRNA targeting the CalS genes are indicated with an arrow, along with the number of reads for sRNAs mapping to this region.

