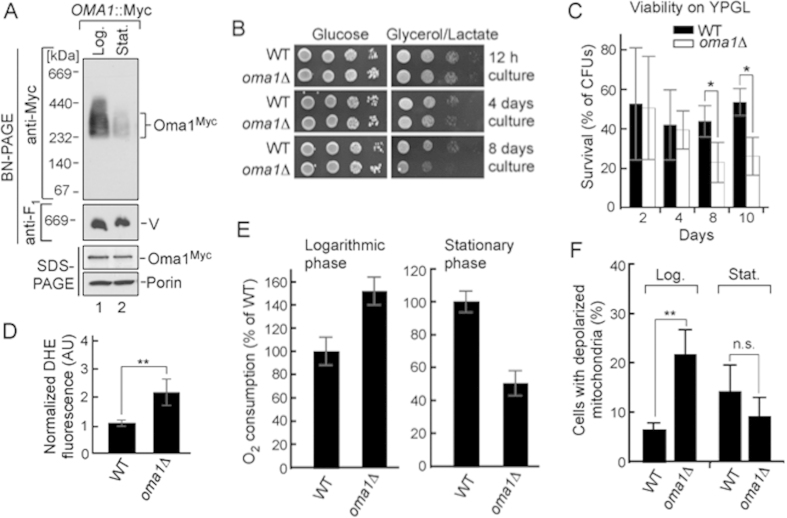
Figure 1. Deletion of Oma1 leads to progressive mitochondrial dysfunction.
(A) Electrophoretic analyses of mitochondria from wild-type (WT) strain with Oma1-13xMyc chromosomal tag isolated at exponential (12 h post-inoculation, A600 of 0.8; Log.) and stationary (48 h post-inoculation, A600 of 8.0; Stat.) phases of growth. Mitochondria (70 μg) were solubilized with 1.5% digitonin and subjected to BN-PAGE; 20 μg of mitochondria were used for SDS-PAGE. Oma1 was detected by immunoblotting with anti-Myc. Monomeric form of Complex V (V; BN-PAGE loading control) visualized with anti-F1 serum; porin was SDS-PAGE loading control. Source data (full-length blots) are available online in Supplementary information. (B) Respiratory growth of WT and oma1Δ strains. Synchronized cells were cultured in YPD medium for 0.5 (12 hours), 4 and 8 days at 28 °C and spotted onto YPD (Glucose) or YPGL (Glycerol/Lactate) plates. Pictures taken after 2 (YPD) or 4 (YPGL) days of growth at 28 °C. (C) WT and oma1Δ strains were grown in YPD medium for indicated number of days, diluted to 600 cells and plated on YPGL plates. Following a 4-days incubation at 28 °C, number of colony forming units was determined (n = 3 biologically independent experiments). The values were normalized to number of colonies that each strain formed when cultured on glucose-supplemented plates. (D) Endogenous superoxide levels in WT and oma1Δ cells. Log-phase cells stained with O2.−-specific dye dihydroethidium (DHE) were analyzed by flow cytometry (n = 4). (E) Oxygen consumption of synchronized WT and oma1Δ cells at log (A600 of 0.8) and stationary (A600 of 8.0) stages of growth; n = 3 independent cultures per each strain. (F) Mitochondrial membrane potential of WT and oma1Δ strains during log and stationary growth, assessed by flow cytometry analysis of JC-1-stained cells (n = 3). Data represent mean values ± S.D. **p < 0.01, *p < 0.05, n.s. = non-significant (t-test).

