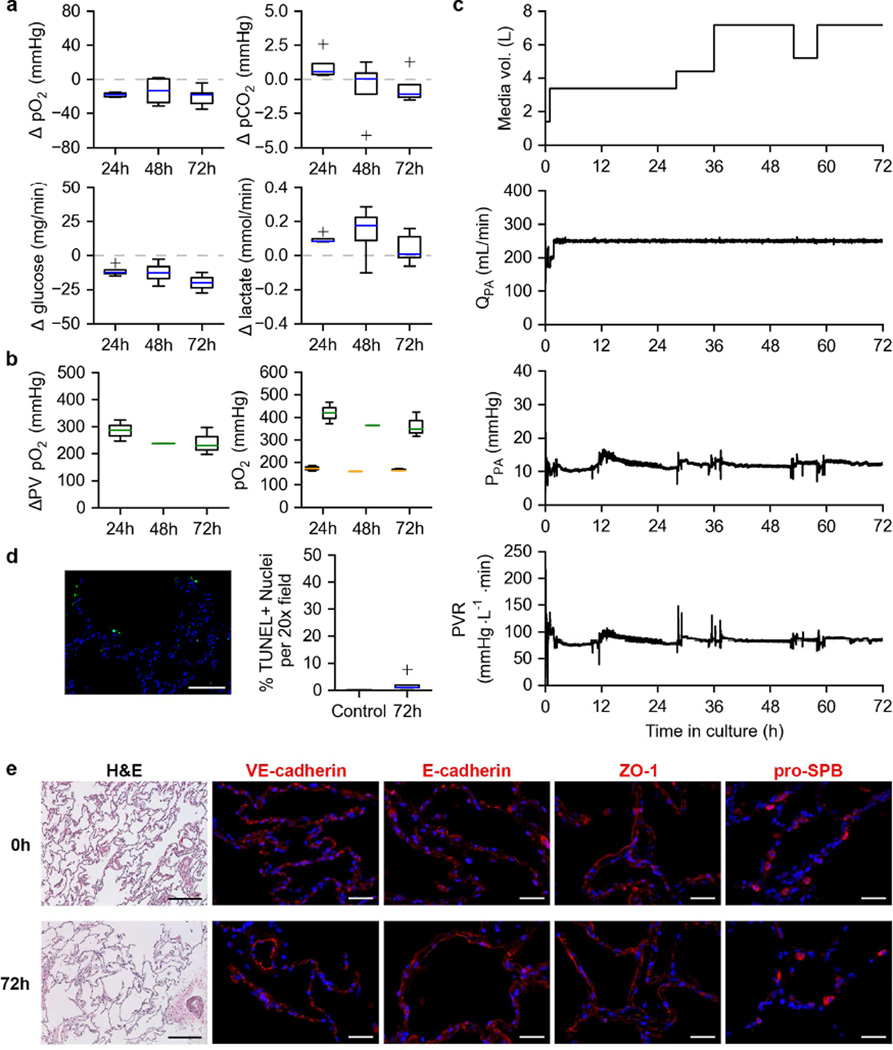
Figure 4. Long term ILC of a human donor lung.
a. Changes in dissolved O2, dissolved CO2, glucose, and lactate content of the culture media from the PA to the PV during long-term (72h) ILC of a single human lung. Media was sampled 4 times per 24-hour period.
b. Oxygen exchange function of a human lung under long-term ILC (left). PA (orange) and PV (green) pO2 values post-functional test (right).
c. Perfusion dynamics of a human lung cultured under long-term ILC. Total media volume in bioreactor system (top). Pulmonary artery flow rate (QPA, 2nd from top). Pulmonary artery pressure (PPA, 2nd from bottom). Pulmonary vascular resistance (PVR, bottom). Black lines indicate means. Gray lines indicate mean ± SEM.
d. Example TUNEL image of human lung tissue after long-term ILC (left). Quantification of TUNEL positive cells (right).
e. Histological and immunofluorescent analysis of porcine lung tissue before (0h) and after (72h) long-term ILC. Hematoxylin and eosin staining (H&E, scale bar, 250 µm). VE-cadherin, E-cadherin, ZO-1, and pro-SPB (red, nuclei blue, scale bar 50 µm).

