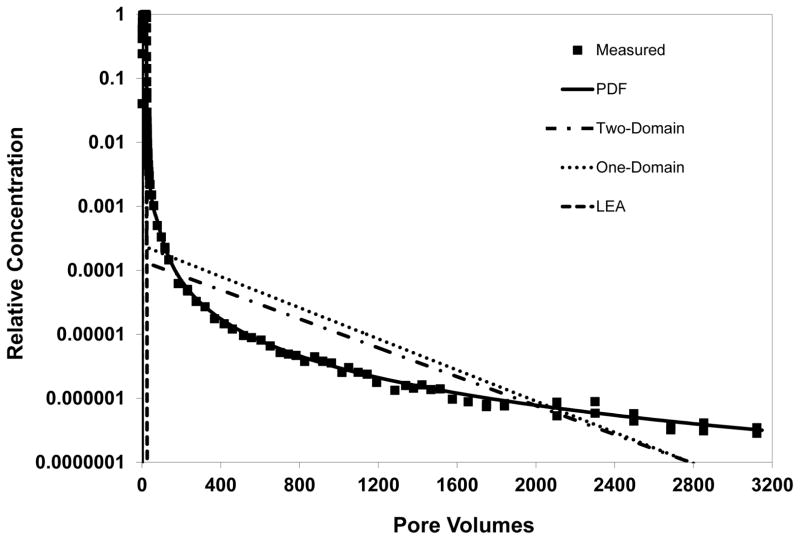
Figure 3.
Comparison of simulated and measured TCE transport. Simulations produced with three different transport models, wherein rate-limited sorption-desorption is represented with the one-domain, two-domain, or continuous-distribution (PDF) function. An ideal control case with instantaneous sorption-desorption (LEA) is also presented.

